


- Coworking
- Coworking Resources
How to create reports in Nexudus
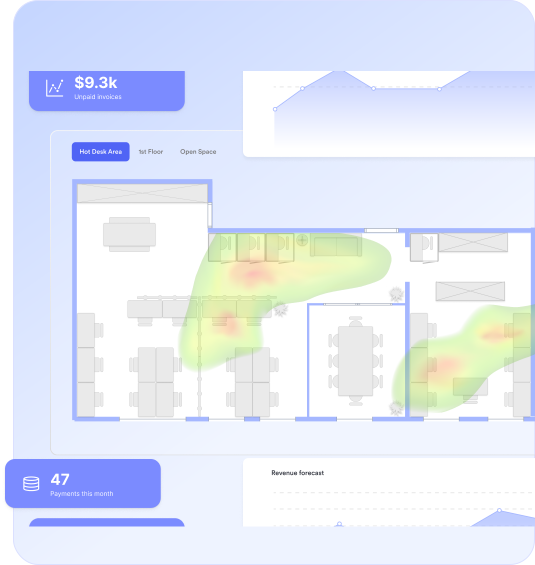
TL;DR
Good reporting starts with good questions. How much revenue has been earned, invoiced or paid? Which invoices need chasing? Which spaces are being used most often? Which memberships are growing, ending or at risk? Which locations are improving, and where do teams need to look closer?
Nexudus gives coworking operators lots of ways to answer them. With Explore, teams can use ready-to-use dashboards and reports for everyday visibility. With Explore Pro, they can go further by building, adapting and saving custom reporting views around the way their business operates.
It all depends on what you need the report to do.
What do you want to know?
A finance team may need to understand what has been earned, invoiced, paid or overdue. An operations team may want to know which resources are in demand, where capacity is underused, or how bookings change across locations. A leadership team may need a shared view of revenue, occupancy, memberships and bookings across every site.
The clearer your question, the easier it is to choose the right report, filter the right data and share something useful with the right people.
Example questions:
- Which locations are growing?
- Which invoices need attention?
- Which plans are gaining or losing members?
- Which spaces are being used most often?
- How are bookings changing over time?
- Where are memberships ending?
- What should leadership review each month?
Not every question needs a custom report. Many everyday questions can be answered with ready-to-use dashboards, filters and drill-downs.
Using Explore out of the box
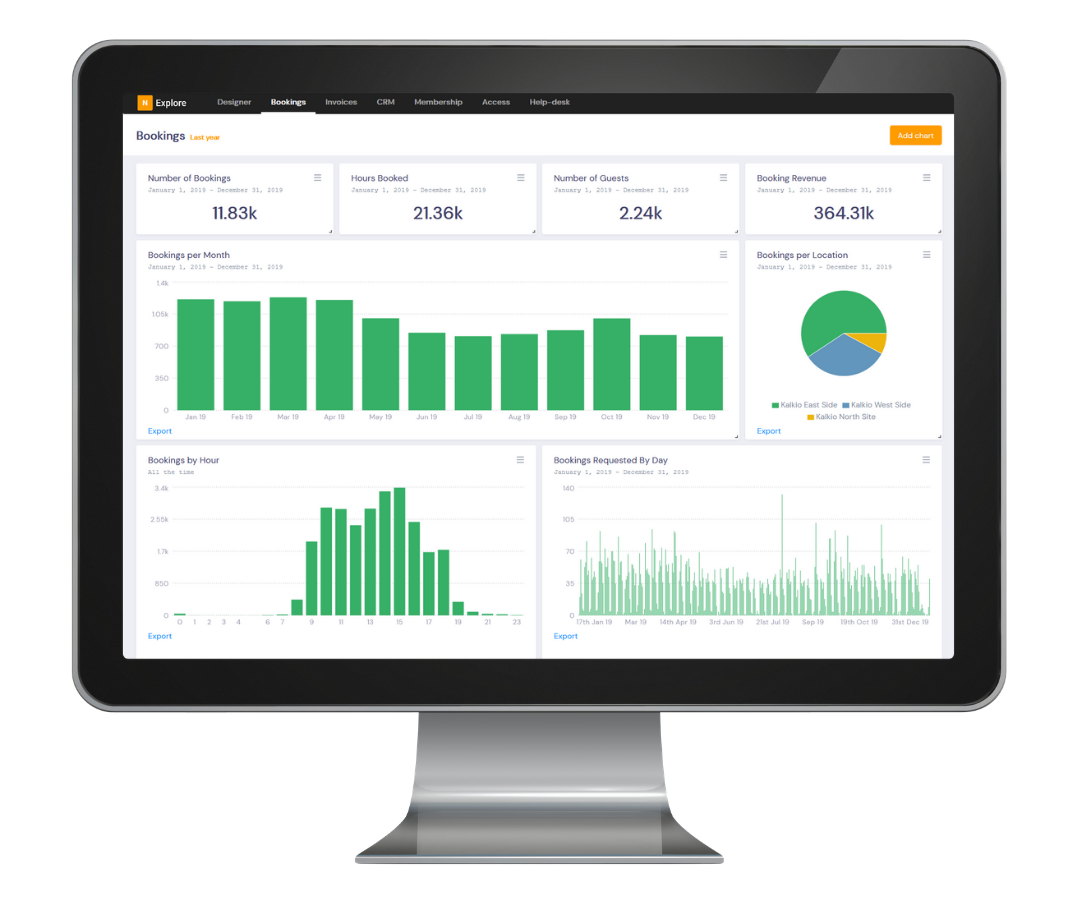
Explore gives coworking operators clear, visual reporting inside Nexudus.
Instead of starting from a blank page, teams can begin with ready-to-use dashboards and reports across areas like revenue, invoices, bookings, occupancy, memberships and operations.
This makes Explore useful for everyday reporting workflows. You can start with a dashboard, filter by date or location, then drill into details behind the headline numbers.
A finance team could use Explore to review revenue, invoices, payments and overdue balances. An operations team could look at bookings, occupancy and utilisation across desks, meeting rooms and other resources. A leadership team could compare performance across multiple sites without rebuilding separate reports for each location.
Filter reports to focus in
A useful report is rarely static. People usually need to narrow data by date, location, customer, plan, resource or another dimension, which is what turns a broad dashboard into a useful answer.
Looking at total bookings might tell you how busy the business is overall. Filtering by location, resource or time period can show which spaces are in demand, where capacity is underused, and how booking activity changes across the business.
The same applies to finance. Total revenue is useful, but teams often need to see what has been earned, what has been invoiced, what has been paid and what still needs chasing. Filtering by location, customer, plan or account gives finance teams the detail they need to understand what is really happening.
Drill into details behind key metrics
Dashboards are useful because they give teams the big picture quickly. But the real value often comes when teams investigate what sits behind a number.
If occupancy is lower than expected, teams may need to check which spaces are affected. If overdue balances are increasing, finance may need to review which customers or invoices need attention. If churn is rising, leadership may need to understand which plans, locations or membership types are changing.
Explore helps you move from headline metrics to the reports, records and patterns that explain them. These workflows matter because reporting decides next actions.

Export or schedule reports
Some reports need to be downloaded, others need to land in someone’s inbox regularly.
Explore supports both types of workflow. You can export reports to PDF or Excel when they need a point-in-time file for analysis, review or sharing. Or you can schedule reports by email, so recurring updates reach the right people without someone exporting data again and again.
This is especially useful for monthly reporting, finance reviews, leadership updates and operational check-ins. Leave csv and spreadsheet exports for one-off analysis and schedule reports you rely on regularly.

Create custom reports with Explore Pro
While Explore gives operators ready-to-use dashboards and reports, Explore Pro supports custom reporting workflows. Teams can build custom reports, create one-off reports for specific questions, duplicate and edit dashboards, use existing reports as a starting point, and create dashboards from scratch.
A team may want to connect membership and location data to understand churn by site, or a dashboard that matches its monthly finance reviews. Most leadership teams want a custom view across revenue, invoices, occupancy and bookings, and multi-location operators need different reporting views for central teams and local teams.
Explore Pro is for anyone needing more advanced business views.
When to use Explore
Use Explore when your team needs a clear view of everyday performance. It’s designed for teams that want ready-to-use dashboards and reports across revenue, invoices, bookings, occupancy, memberships and operations.
It helps teams answer common reporting questions and is especially useful when teams need a shared reporting foundation. Everyone across the business can work from consistent dashboards and reports, rather than relying on separate spreadsheets or one-off exports.
When to use Explore Pro
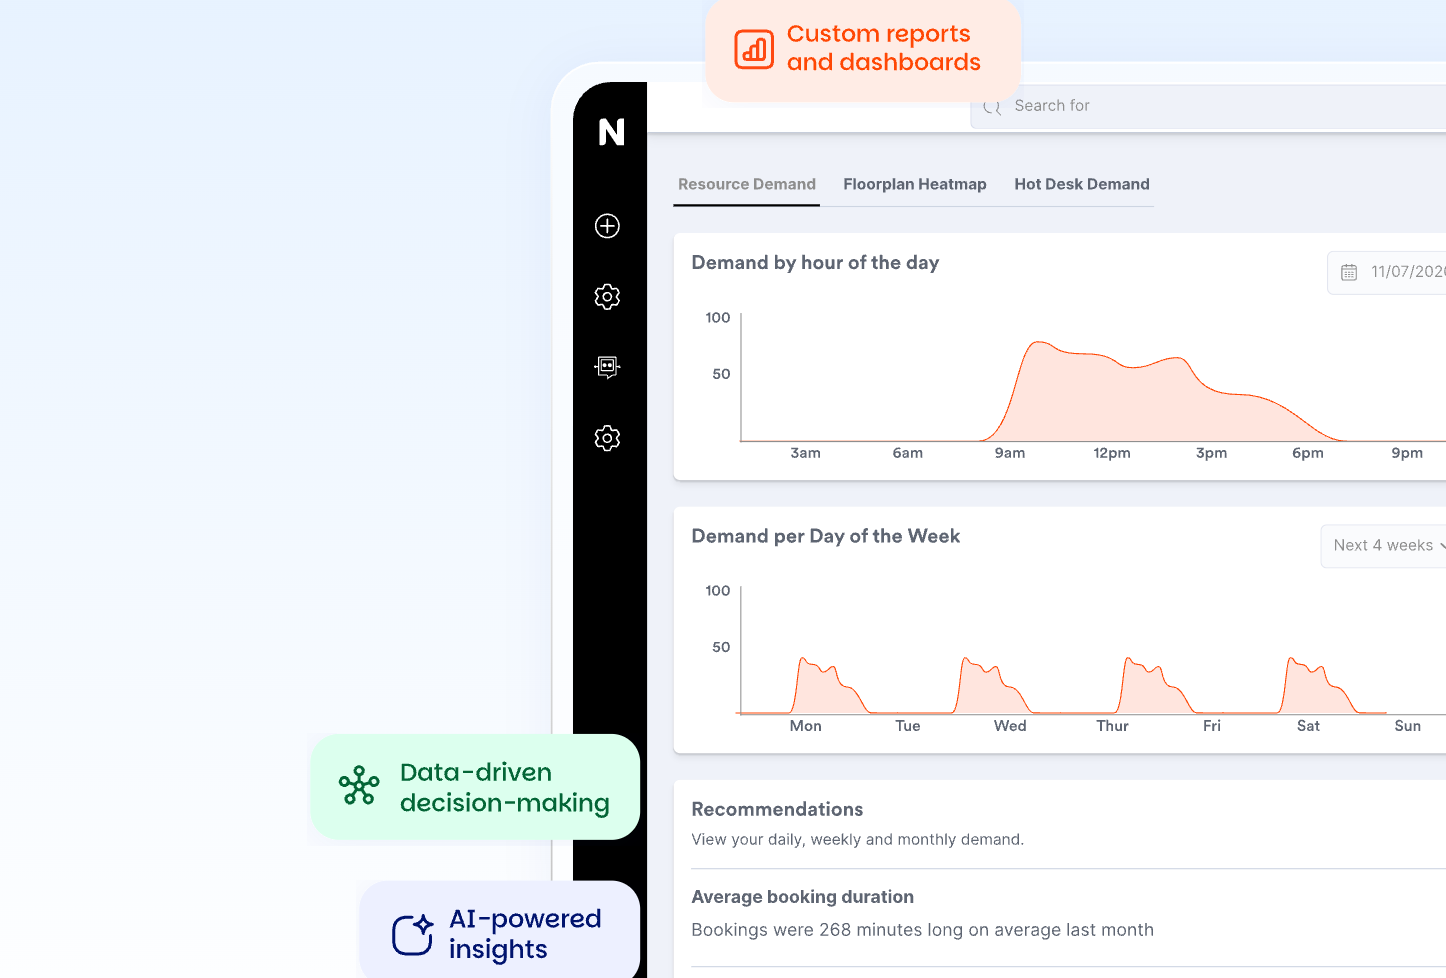
Use Explore Pro when your team needs to build, adapt or save custom reporting views. That could mean creating a custom dashboard, building a report around a specific workflow, adapting an existing dashboard for location teams, or creating one-off reports to answer questions that come up during planning or review.
Explore Pro is also useful for operators that have built reporting workflows outside Nexudus using CSV exports, spreadsheets, Airtable or other manual dashboards.
The data already lives in Nexudus and Explore Pro is built to give you more ways to connect data inside the platform.
Choose Explore if your team needs ready-to-use dashboards and reports for everyday visibility.
Choose Explore Pro if your team needs to build, adapt and save custom reporting views around the way your business operates.
Good data in, good reporting out
Reports are only as useful as the data behind them. Before building lots of reports, it is worth checking that the foundations are in place. Locations, resources, plans, memberships, invoices, payments and accounts should reflect how the business actually operates.
Clean setup makes reports easier to read, easier to compare and trust. Whether a team is using ready-to-use reports in Explore or building custom views in Explore Pro, audit your setup to make sure your data is reliable.
Want to know more about
how Nexudus could help your business?
We’re here to answer any questions you have.
Latest articles
-

- Coworking
- Coworking Resources
Practical AI Lessons for Coworking Operators from GWA Denver 2026
Damian on October 1, 2026 -

- Coworking
- Coworking News
- Technology
AI didn’t add a feature to coworking software. It’s rewriting what the product is.
Jane Robathan on September 30, 2026 -

- Coworking
Advanced Coworking Analytics: When Standard Reports Fall Short
Emily Nguyen on September 15, 2026