


- Coworking
- Coworking Resources
Multi-location Coworking Reporting: What Operators Need To See Across Every Site
TL;DR
Multi-location coworking reporting helps operators compare performance across every site, using shared metrics for revenue, occupancy, bookings, invoices, memberships and member activity.
At one location, you can rely on local knowledge. Across several locations, you need consistent reporting that shows where each site is performing well, where it needs attention and what should happen next.
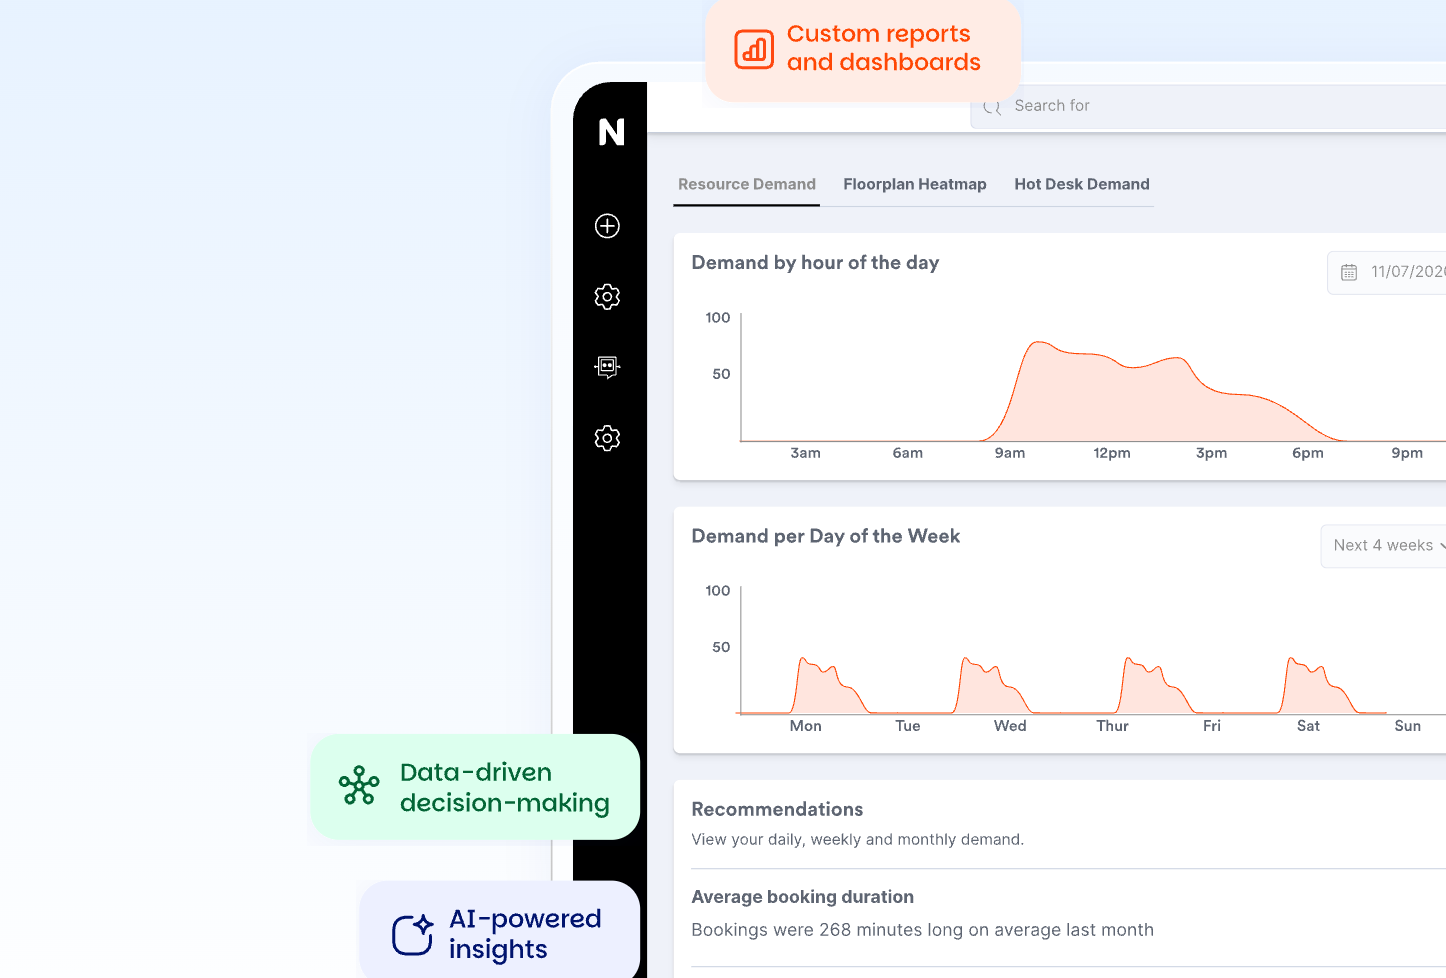
Explore gives coworking teams a clearer reporting layer for comparing performance by location, drilling into the detail behind KPIs, exporting reports and sharing regular updates with leadership, finance and operations teams.
At one coworking location, you can usually tell how things are going by walking the floor.
You know which meeting rooms are always busy. You know when the building gets quiet. You know which members are in every day, which plans sell well and which invoices need chasing. But for several locations, all of this gets a whole lot harder.
One site may look busy but have weak revenue. Another may have strong meeting room demand but rising overdue invoices. A third may have good occupancy, but falling member engagement.
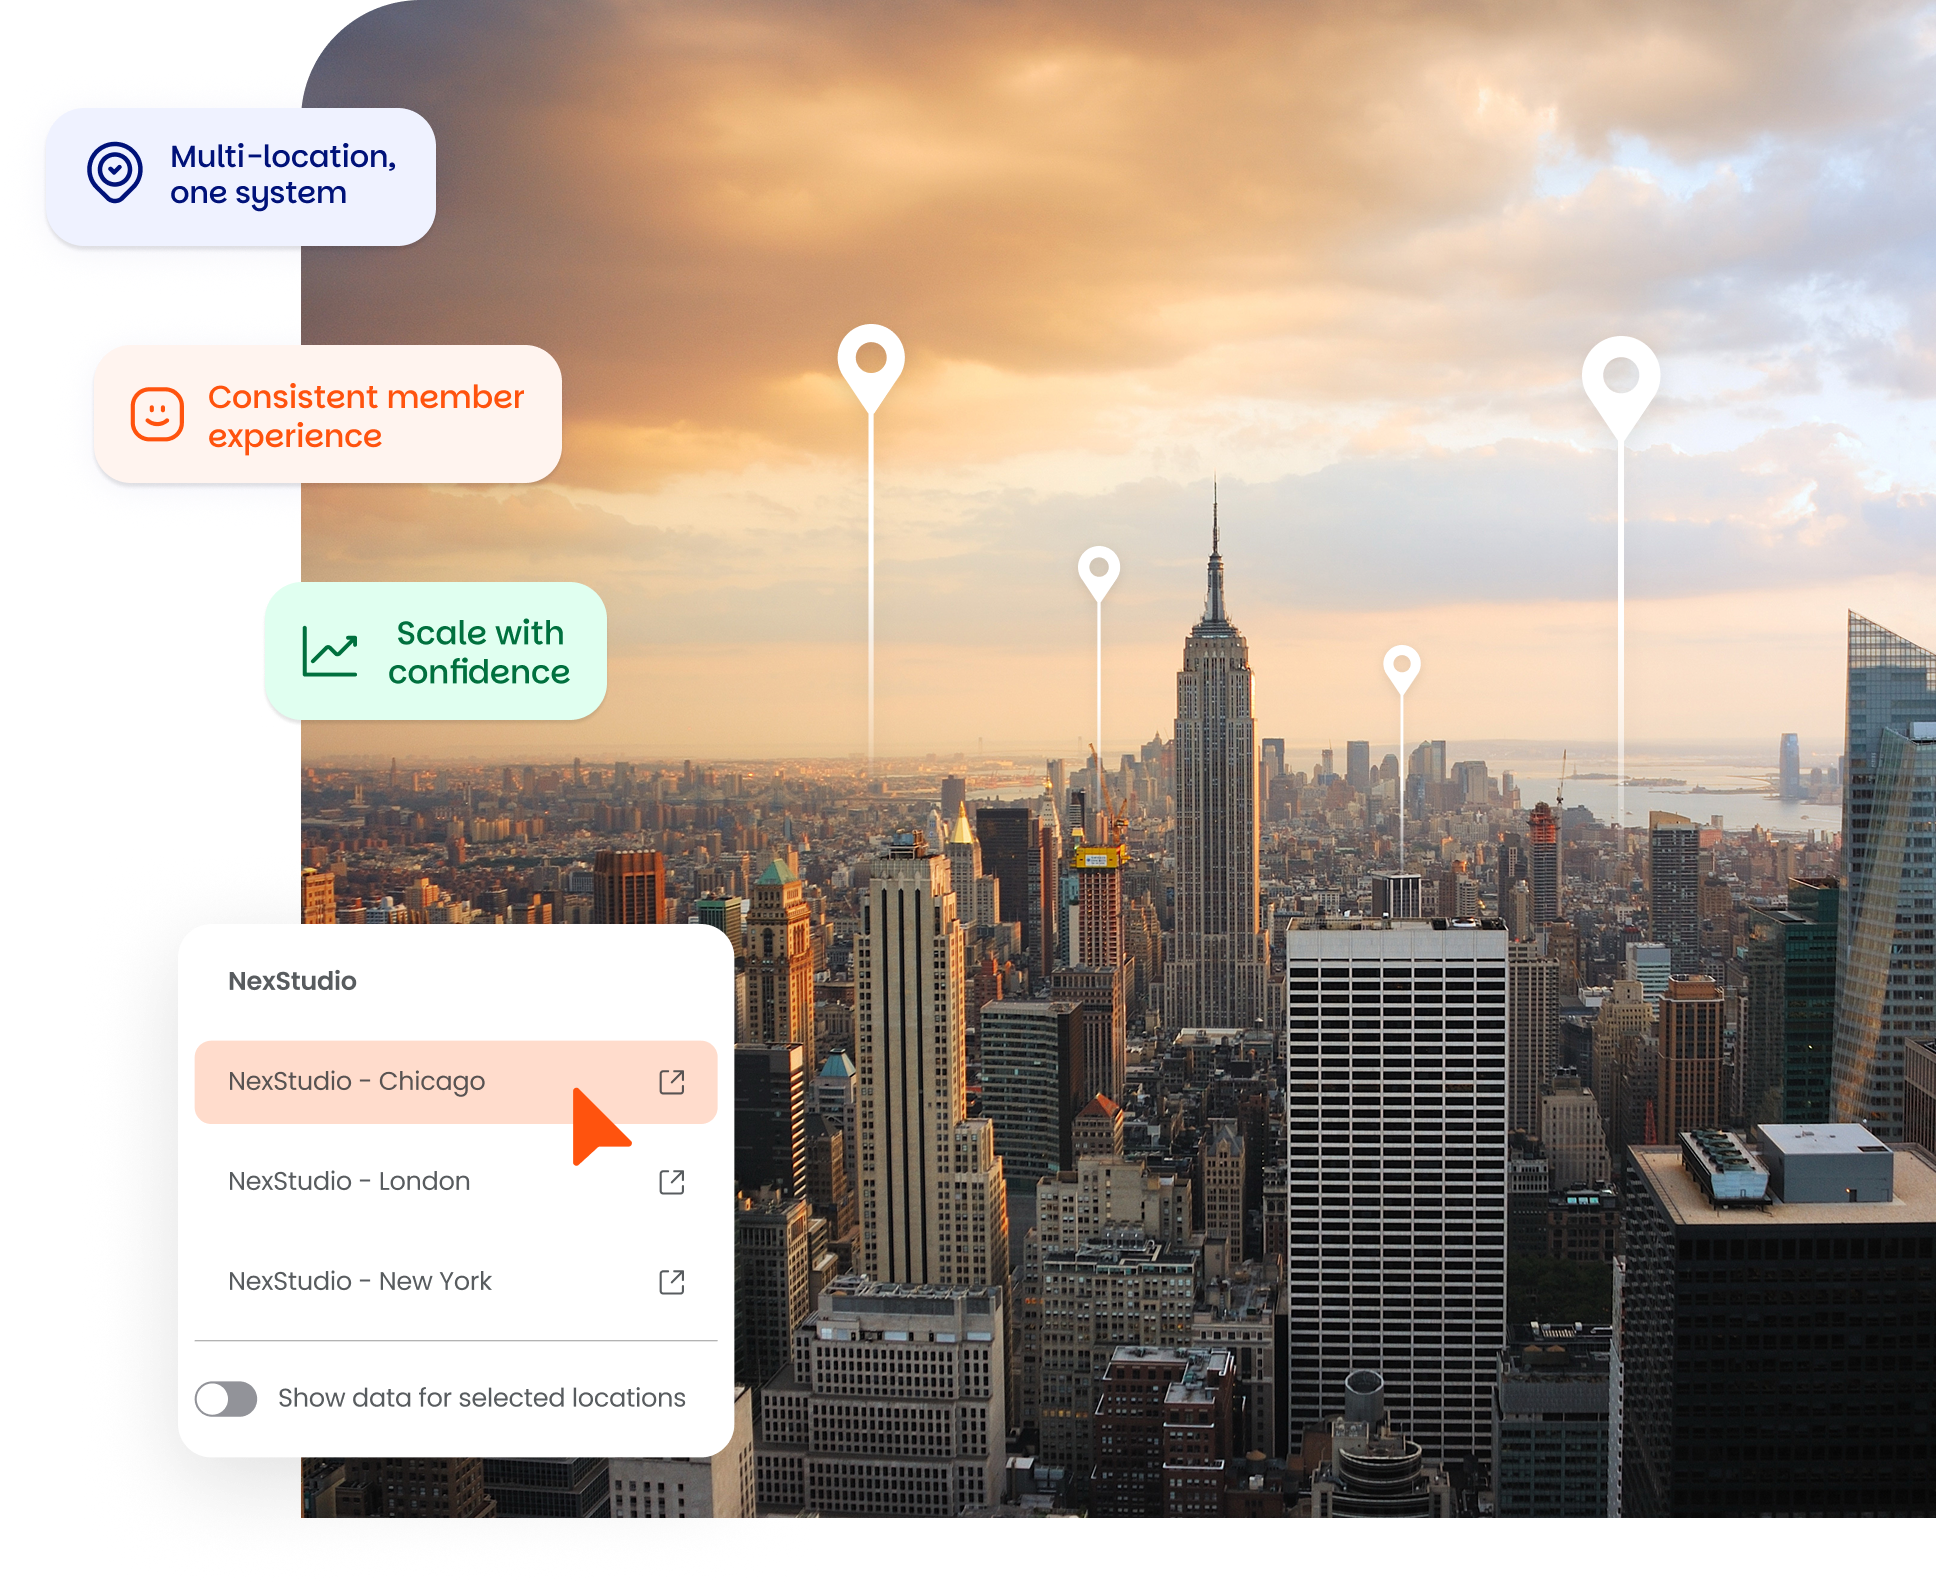
Multi-location reporting helps operators move from site-by-site anecdotes to a clearer view of portfolio performance.
It gives leadership, finance, operations and local teams a shared way to compare what is happening across every location, then decide where to focus.

Why reporting gets harder when coworking operators grow
Growth changes reporting. The challenge is that every site has its own context. Local teams know why a number moved, but leadership still needs a consistent way to compare sites. Multi-location reporting gives operators both: a portfolio view for decision-making, and site-level detail for action.
An different teams need different reports. Leadership wants to know which locations are growing, which are underperforming and where to invest next.
Finance wants to know which sites are generating recurring revenue, which invoices are overdue and where payment issues are building up. Community teams want to see member activity, engagement and retention.
And then, local managers need enough detail to run their site without waiting for someone else to build a spreadsheet.
That is why multi-location reporting needs more than a collection of separate site reports. Operators need comparable metrics, shared definitions and a clear way to move from portfolio view into location-level detail.

The questions multi-location reporting should answer
The best multi-location reports start with practical questions and decisions, not dashboards.
This isn’t about how many charts can you can show but thinking about what the team needs to move forward.
A leadership team may want to know which locations are driving growth. Finance may want to know where overdue invoices are building up. Operations may want to understand why one site has strong demand on Tuesdays and another is quiet by midweek.
Those questions are different, but they all need the same foundation: clean, comparable reporting by location.
- Which locations are generating the most revenue?
- Which sites have the strongest occupancy?
- Where is utilisation lower than expected?
- Which resources are in demand by site?
- Where are invoices overdue or payments failing?
- Which locations are gaining or losing members?
Different sites rarely perform in exactly the same way. A city-centre location may have strong meeting room demand but more transient members. A neighbourhood location may have lower booking volume but better retention. A large site may have higher revenue but weaker revenue per desk, while smaller sites often appear less impressive in total revenue but perform better against available space.<
Multi-location reporting helps operators compare those differences fairly.
The core reports multi-location operators need
Multi-location reporting should bring together the main areas that shape performance: revenue, occupancy, bookings, memberships and operations.
Revenue and invoicing
Revenue is usually where location comparisons start, but total revenue does not tell the whole story. One site may bring in more overall income because it is larger. Another may have stronger recurring revenue, fewer overdue invoices or better revenue per desk.
A good multi-location revenue view should help operators compare the quality of revenue, not just the volume.
Useful reports include:
- Revenue by location
- Recurring vs one-off revenue
- Overdue invoices
- Failed payments
- Revenue by plan, product or customer
If one location has high membership revenue but rising overdue invoices, the issue may not be demand. It may be payment process, customer mix or local account management.
A site with strong sales can still create a finance problem if invoices are regularly overdue. A site with lower total revenue may still be performing well if it has strong recurring income and low payment risk.
Occupancy and utilisation
Occupancy and utilisation are central to multi-location reporting because they show how well space is being used.
Operators should be able to compare:
- Occupied vs vacant inventory
- Desk, office and area occupancy
- Resource utilisation
- Underused spaces
- Revenue occupancy
- Revenue per occupied desk
- Revenue per available desk
Occupancy shows what is sold or assigned. Utilisation shows how bookable space is actually used.
Both matter across a portfolio.
A location may have high occupancy but weak revenue. Another may have low occupancy but high utilisation of certain bookable resources. Without both views, operators can miss the real issue.
Bookings and demand
Bookings show how members and customers expect to use each location.
Multi-location booking reports should show:
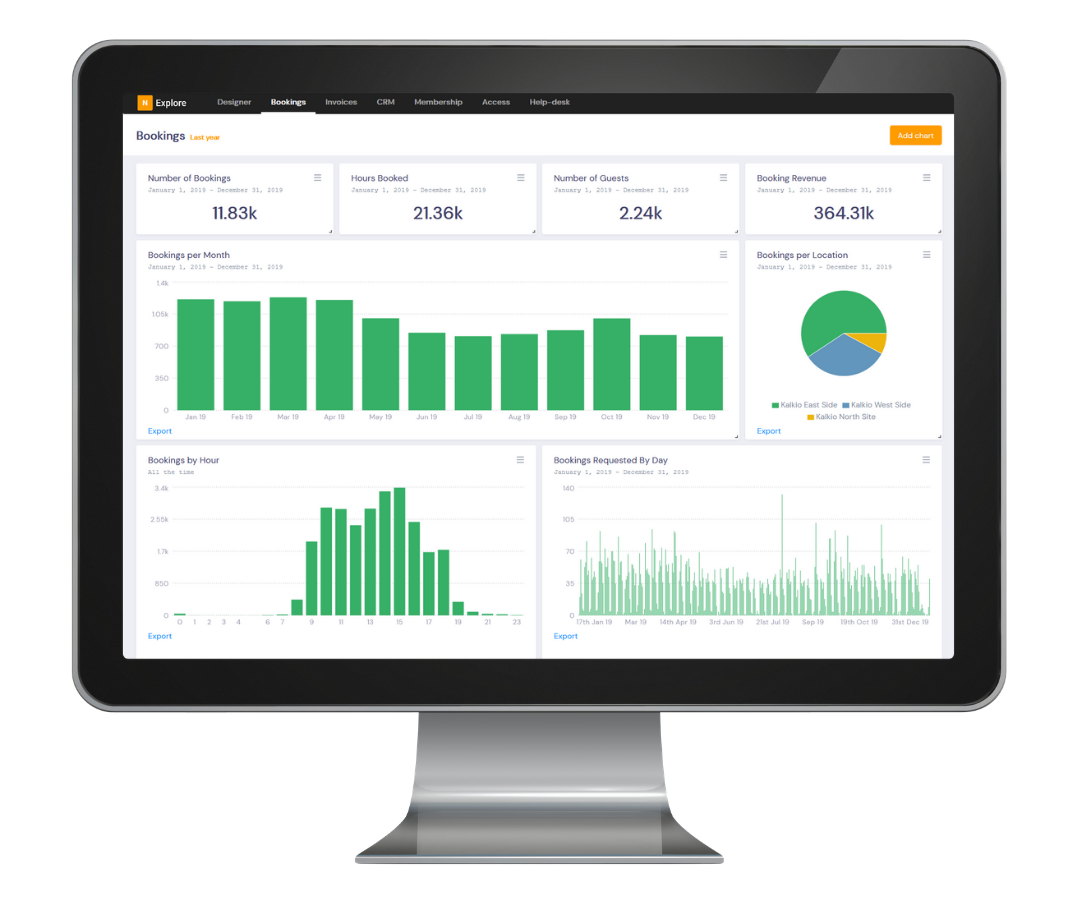
- Bookings by location, resource, hour or weekday
- Booking revenue
- Average booking duration
- Most booked resources
- No-shows and cancellations
- Credits used
This helps operators see demand patterns across the portfolio.
If Friday meeting room demand is low across several sites, that may be a wider pricing or packaging opportunity. If one location has high no-shows, the issue may be local policy or member behaviour. If another has strong demand for a particular resource, it may be worth testing that layout or offer elsewhere.
Membership and retention
Growth and retention need to be tracked by location, not just across the whole business.
Useful reports include:
- Active members
- New members
- Lost members
- Churn
- Retention
- Revenue churn
- Membership revenue by plan
- Average length of stay
- Plan performance by location
A portfolio-wide churn number can hide local issues.
One location may be retaining members well, while another is losing high-value accounts. One plan may work well in a larger site but perform poorly in a smaller one. One building may keep attracting new members but lose them after a short period.
Segmenting retention by location helps operators understand where the member experience, pricing or product mix may need attention.
Operations and engagement
Operational reporting gives teams a view of day-to-day activity across sites.
This can include:
- Check-ins by weekday or hour
- Member activity
- Purchases or orders
- Tickets
- Event activity
- Support patterns
These signals help operators see whether each location is active, supported and running smoothly.
A site with falling check-ins may need a closer look at member engagement. A site with rising support tickets may have a facilities or service issue. A site with low community activity may need different programming or local support.
Why comparable metrics matter
Multi-location reporting only works when every site is measured consistently.
A “busy” site, a “high-performing” site and a “profitable” site are not always the same thing.
One location might have lots of bookings but low booking revenue. Another might have fewer members but stronger recurring income. A third might have high occupancy but weak retention.
Comparable metrics help operators avoid judging sites by feel alone.
They also help teams have better conversations.
Instead of asking, “Why does this site feel quiet?” the team can ask:
- Is occupancy down?
- Is utilisation down?
- Are bookings down at particular times?
- Has revenue changed?
- Are members cancelling?
- Are invoices overdue?
- Is the site underperforming against similar locations?
That shift matters. It moves the conversation from opinion to action.
How reporting changes decisions across a portfolio
Good reporting helps operators decide where to focus.
For example, multi-location reports can help teams:
- Test pricing changes in one location before rolling them out
- Compare Friday meeting room demand across sites
- Identify locations with high occupancy but weak revenue
- Spot invoice or payment issues by site
- Review plans that work well in one market but not another
- Decide where to expand, reconfigure or invest
- Support local managers with the right actions
- Prioritise retention work in locations with rising churn
- Compare resource demand before changing layouts
The point is not simply to rank locations from best to worst.
It is to understand what each site needs.
A location with weak revenue may need pricing changes. A location with weak utilisation may need a layout review. A location with rising churn may need more member engagement. A location with overdue invoices may need finance follow-up.
Multi-location reporting helps each team see its part of the problem.
What to look for in multi-location coworking reporting software
Multi-location operators need reporting that can handle both the portfolio view and the local view.
Useful features include:
- Location-level filters
- Cross-location dashboards
- Consistent metric definitions
- Drill-downs from summary to detail
- Revenue, invoice, occupancy, booking and retention reports
- Exports for deeper analysis
- Scheduled reports for regular updates
- Role-based views for leadership, finance and operations
- Custom reporting when standard reports are not enough
The best setup should help different teams answer different questions without creating several versions of the truth.
Leadership may need a portfolio dashboard. Finance may need weekly invoice and payment reports. Operations may need booking and utilisation data. Local managers may need a filtered view of their own site.
How Nexudus Explore supports multi-location reporting
Explore gives teams a clearer reporting layer for understanding performance across revenue, occupancy, bookings, retention and operations.
Operators can review high-level dashboards, filter reports by location, drill into the data behind KPIs, export reports and schedule updates for the right teams.
That means leadership can see portfolio performance, while local teams can focus on the sites they manage.
For multi-location operators, this helps turn reporting into a regular operating rhythm:
- Leadership reviews portfolio performance
- Finance monitors revenue, invoices and overdue payments
- Operations reviews occupancy, utilisation and demand
- Community teams track member activity and retention
- Local managers receive the reports they need for their location
Instead of rebuilding reports manually each month, teams can work from a clearer view of the business.
Multi-location reporting checklist
If several of these are difficult, your reporting isn’t keeping up with the way your business operates.
Checklist
- Can you compare revenue across locations?
- Can you see occupancy and utilisation by site?
- Can you identify underused resources by location?
- Can finance review overdue invoices by site?
- Can leadership get a regular portfolio report?
- Can local managers see the data they need without building spreadsheets?
- Can you compare member growth and churn by location?
- Can you see booking demand by resource, day and hour?
- Can reports be filtered, exported and shared automatically?
- Can your team move from a portfolio KPI into the records behind it?
See performance across every location
Multi-location coworking reporting helps operators compare sites, spot issues and make clearer decisions across the portfolio.
With Explore, teams can understand performance across revenue, occupancy, bookings, retention and operations, then share the right reports with the right people.
Want to know more about
how Nexudus could help your business?
We’re here to answer any questions you have.
Latest articles
-

- Coworking
- Technology
Nexudus AI Agents: The Different Types and What They Do
Emily Nguyen on October 12, 2026 -

- Coworking
- Coworking Resources
Practical AI Lessons for Coworking Operators from GWA Denver 2026
Damian on October 1, 2026 -

- Coworking
- Coworking News
- Technology
AI didn’t add a feature to coworking software. It’s rewriting what the product is.
Jane Robathan on September 30, 2026