


- Coworking
- Coworking Resources
- Technology
Need to Make Smarter Decisions? Your Guide to Coworking Analytics Software
TL;DR
Coworking operators already have useful data across bookings, billing, memberships, invoices, access, check-ins and member activity. The hard part is turning it into a clear view of performance.
The right coworking analytics software helps you understand how your space is being used, where revenue is coming from, which members may need attention and how each location is performing.
Nexudus brings reporting and analytics into the wider operating platform, helping teams track revenue, occupancy, bookings, retention and daily operations without relying on disconnected spreadsheets.
The best coworking brands are supported by coworking analytics software. A quick #coworking browse on Instagram reveals hundreds of stylish workspace ecosystems where top-tier amenities, well-designed floor plans and great minds come together to thrive.
But every coworking operator knows that keeping multiple plates — or rather, spaces — spinning requires more than luck and intuition.
Every booking, check-in, invoice, payment, membership and support request tells you something about how your business is running. The problem is rarely a lack of data. It is being able to read what is already happening and use it to make a decision.
- Which rooms are always busy?
- Which resources look popular but do not generate enough revenue?
- Which members have stopped engaging?
- Which invoices need chasing?
- Which location is performing well, and which one only looks busy?
Coworking analytics, delivered in an accessible and actionable format, enable you to optimise both your physical workspaces and the member experience. The result is smarter, more confident decision-making.
Analytics help single-space operators thrive in the long term. But they are also particularly important for growing operators managing multiple locations. Data transparency gives you visibility across your portfolio, allowing you to compare locations and view performance in one place.
In this article, we’ll dive into the data worth tracking and how to turn it into something your team can actually use.
Why data is a critical lever for coworking growth
Before coworking software started using data to provide more useful insights — for Nexudus, this began developing further in the early 2020s through features such as Trends and Insights — operators relied heavily on anecdotal evidence and intuition when configuring their spaces.
At one location, you can get away with feel for longer.
You probably know which meeting rooms are popular, when the building gets busy and which members are in most days. You can walk the floor, speak to your community team and build a decent picture.
While there will always be a place for that all-important intuition, smart operators also prioritise data-led decision-making, which provides clarity and an ever-increasing degree of nuance.
But the difficulty grows with the business. Add more locations, membership types, resources, teams and billing rules, and old reporting habits begin to strain.
Finance needs accurate invoice and payment data. Community teams need engagement signals. Operations needs bookings, access and usage data. Leadership needs a regular view of revenue, occupancy, churn and growth.
When those views sit in different places, reporting becomes a recurring admin job. Your team exports information, cleans spreadsheets, chases missing answers and rebuilds the same reports next month.
The bigger the operation, the more expensive that habit becomes.


The data that matters most for flexible spaces
Every square foot of your coworking space has value—if it’s utilised effectively.
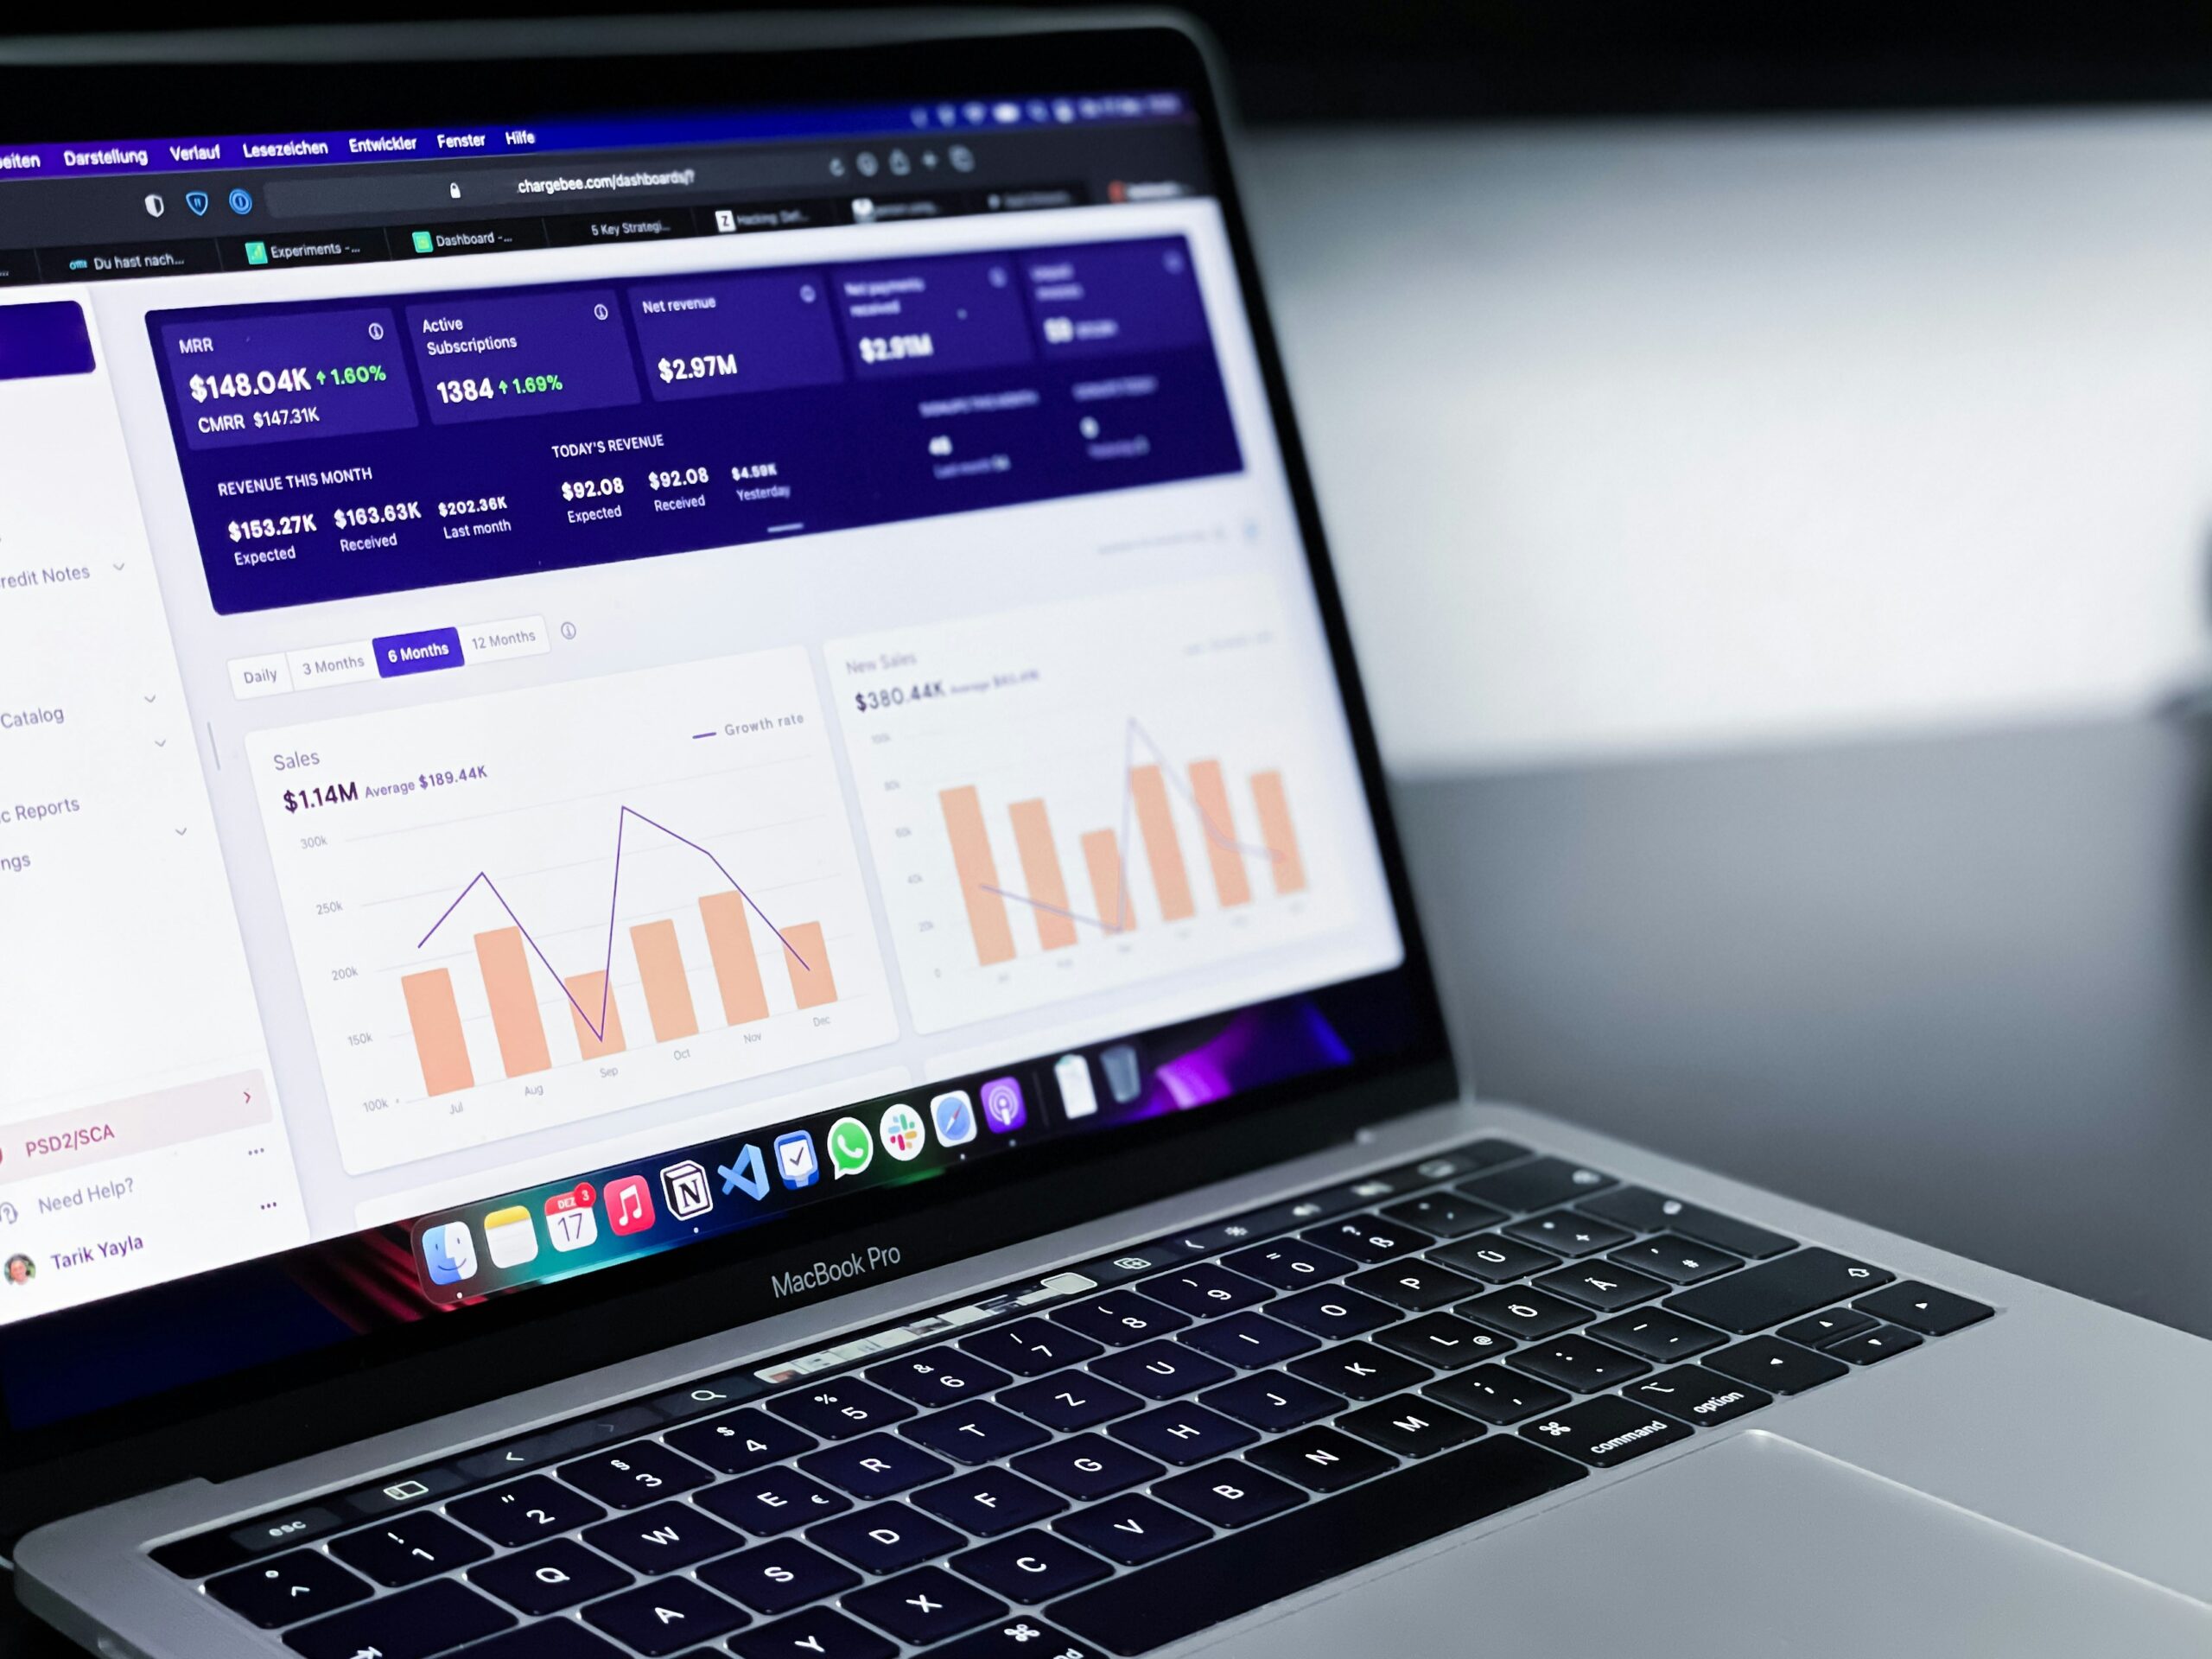
Having data at your fingertips helps you understand how your space performs and identify areas for change. Most operators need visibility across the same core areas: occupancy and utilisation, bookings, revenue, retention and location performance.
Each provides a different part of the picture.
A long list of disconnected figures will not tell you very much. The aim is to group your metrics around the questions you need to answer and the decisions your team needs to make.
Occupancy and utilisation
Occupancy and utilisation are often talked about together, but they answer different questions.
Occupancy shows how much of your available inventory is sold, occupied or assigned. That might include desks, offices or other assignable spaces.
Utilisation shows how often a bookable resource is actually being used compared with the time it could be used. Meeting rooms, hot desks, parking spaces and podcast studios are good examples.
Both matter because a private office may be occupied but underpriced, yet a meeting room may be fully booked on Tuesday mornings and empty on Fridays. A hot desk area may look busy at peak times but still have spare capacity across the month.
Coworking analytics software can help you see:
- Which desks, rooms and resources are used most
- Which areas are underused
- When demand peaks and drops
- How usage changes by day, hour or location
- How booking behaviour compares with actual attendance
- Where layout, pricing or policy changes may be needed
Heatmaps add another layer by showing which areas of a floor plan are booked most frequently and which resources generate the most revenue.
You might discover that the desk everyone assumes is unpopular is regularly booked, while a beautiful breakout area takes up valuable space without contributing much to the member experience or the bottom line.

In their own words: "Automation means we’re able to operate with a lean team much more efficiently."

Chris Chowen
Innovation and Technology Manager, Wired Sussex
Booking demand and peak hours
Bookings reveal intent by showing when members expect to use your space, which resources they value and how demand changes over time.
Useful booking data includes:
- Total bookings
- Hours booked
- Average booking duration
- Booking revenue
- Demand by hour or weekday
- Most-booked resources
- Top booking customers
- No-shows and cancellations
- Credits used
This data can quickly lead to practical changes.
If meeting rooms are busy every Monday morning, your staffing may need to reflect that. If a resource is rarely booked after 3pm, it may require different pricing, packaging or promotion.
If a meeting room is the subject of constant no-shows, it might be time to change your booking or cancellation policy.
Nexudus Resource Demand uses booking patterns to identify the hours and days when resources are likely to experience higher or lower demand. Where dynamic pricing is enabled, these patterns can also support automated price adjustments.
Revenue, invoices and payments
Revenue reporting gets complicated quickly in coworking as income can come from memberships, private offices, meeting rooms, day passes, deposits, services, products, events, credits and one-off fees.
Some revenue is recurring, some is ad hoc and some has been invoiced but not paid. Some may appear in a forecast but change when a member cancels or a new contract begins.
A single headline number cannot tell you all of that.
Useful financial reporting should include:
- Total revenue
- Recurring membership revenue
- One-off revenue
- Invoiced revenue
- Paid and unpaid invoices
- Overdue balances
- Payment failures
- Refunds
- Deposits
- Revenue by location, product, resource or customer
Revenue analytics help you identify where income is coming from, which resources are driving the business and which are underperforming.
You might decide to invest further in your most lucrative areas and think about how pricing, packaging or marketing could increase revenue elsewhere.
Invoice and payment reporting tells you whether recorded revenue is actually turning into cash. A strong sales month is less impressive if unpaid invoices and payment failures are rising alongside it.
Revenue Forecasts in Nexudus estimate future income based on active contracts. Teams can view forecasts across locations, customers, contracts and proposals, with filters for one-off charges, deposits and free items.
Membership growth, engagement and churn
New members are easy to celebrate. Retention is where the more subtle — and often more useful — signals appear.
A space can keep signing up new members while quietly losing valuable ones, a location can look active while engagement is falling and a membership plan can attract plenty of people but fail to keep them.
But great analytics help teams understand:
- Active members
- New and lost members
- Membership starts and cancellations
- Contract value
- Average contract length
- Churn rate
- Revenue churn
- Engagement levels
- Lifetime value
- Members who have stopped booking, checking in or interacting
Intervening early can prevent churn.
A reduction in check-ins, bookings or payment activity can signal that a member is disengaging. It does not always mean they are about to leave — circumstances change and not every quiet week is a crisis — but it gives the community team a reason to look more closely.
Nexudus Churn and Engagement helps operators understand which members may be at risk of churning and how engaged they are with the space. Engagement is grouped into tiers, allowing teams to prioritise the people who may need attention first.
Multi-location performance
Multi-location operators require another level of reporting.
Each location may have a different layout, pricing structure, tax setup, member mix and way of operating. Leadership still needs to see how the portfolio is performing as a whole.
That does not mean flattening every location into one average: Good multi-location reporting allows teams to compare performance while retaining the local detail that explains it.
Operators need to track:
- Revenue by location
- Occupancy and utilisation by site
- Booking demand by resource and location
- Overdue invoices by location
- Membership growth by site
- Member activity across locations
- Performance trends over time
A site with lower revenue may be struggling, or it may be newer and developing exactly as expected. Another may report strong occupancy while achieving lower revenue per desk than the rest of the portfolio.
The numbers tell you where to look and local context tells you what they mean so your reporting moves from “what happened?” to “where should we focus?”
Smart operators aren’t just tracking — they’re acting
Data tracking and action go hand in hand. After all, the aim is to work smarter by reducing your team’s workload — so say farewell to spreadsheets.
When it comes to coworking management software, analytics, action and automation sync in real time.
Smart notifications
Automation can deliver timely nudges based on data insights. If, for example, one of your meeting rooms is the subject of constant no shows, your coworking management software can suggest a change in booking policy.
If your meeting rooms are busy on a Monday morning, your software can automate emails to members offering discounts on meeting rooms at off-peak times.
If an invoice remains unpaid, the system can send reminders rather than relying on someone to remember to chase it.
Predictive analytics
Analytics can also help operators prepare for what may happen next.
Predictive reporting can identify periods of likely resource demand, estimate future revenue from active contracts and surface behavioural patterns associated with member disengagement.
These insights should support your team’s judgement, not replace it.
Whether you act on a recommendation is totally up to you!
From static reports to clearer dashboards
Traditional reporting often forces teams into fixed views.
You open a report. You get the table. You export it. You filter it somewhere else. You send it to someone. Then you do it again next week or next month.
That can work for a while, but it becomes slow as your reporting requirements grow.
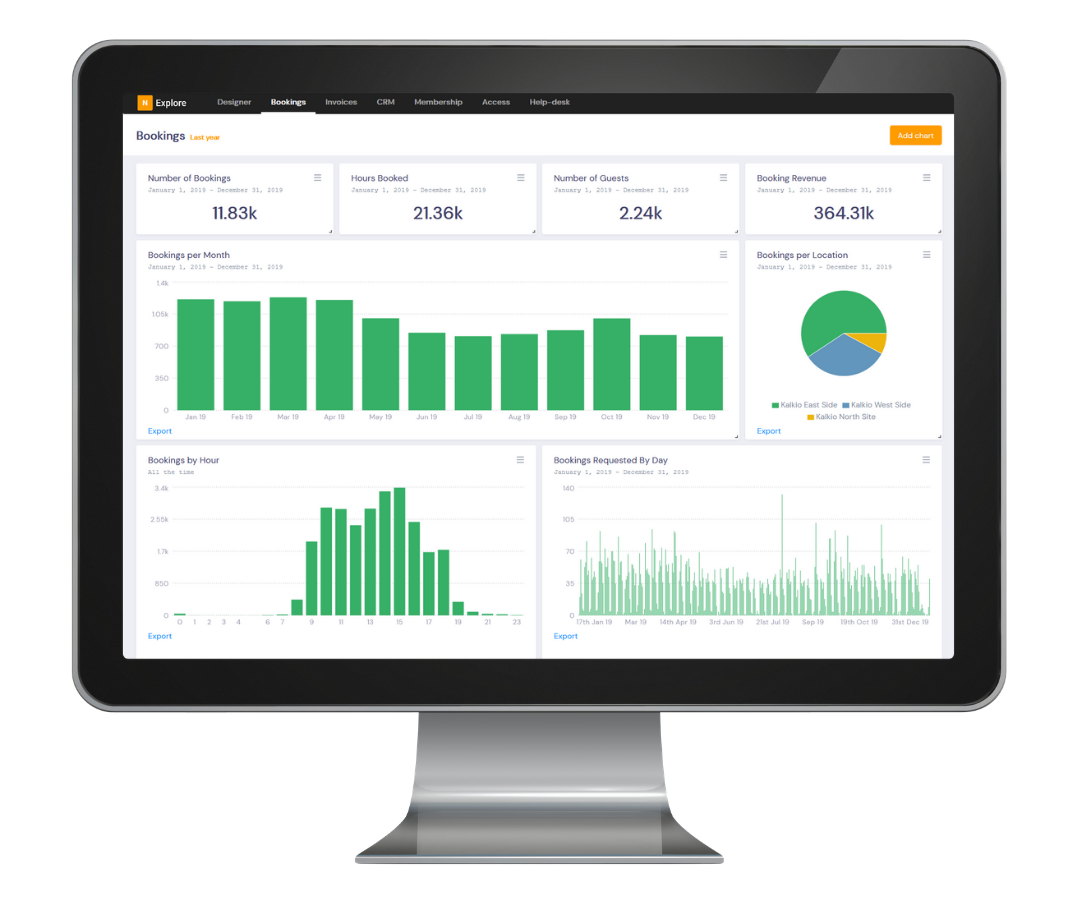
Nexudus Explore gives teams a clearer way to work with reporting data. Dashboards and detailed reports sit within the same workflow, so users can begin with a high-level view and move into the numbers behind it.
Teams can:
- Review high-level dashboards
- Filter reports by date, location, company and other fields
- Move from KPI cards into underlying data
- Export reports in formats including CSV and PDF
- Schedule regular reports to be sent by email
- Duplicate and edit dashboards where available
- Build custom reports for more advanced requirements
Different people need different levels of detail.
A front-of-house team may only need a daily bookings report, while a finance lead might want overdue invoices delivered every Monday morning.
General managers need to compare location performance, and power users might want to build custom views combining several datasets.
Explore gives those users a reporting layer inside Nexudus rather than forcing them to construct every answer outside the platform.
Not every question requires a custom dashboard, of course. Standard reports remain useful for repeatable operational tasks, while advanced analytics provide more flexibility when teams need to compare, investigate or combine data.

Workflow in action: analytics that actually help your team
The best way to understand analytics is to look at what teams do with it.
Impact Hub King’s Cross: reducing manual work
Impact Hub King’s Cross previously managed members and invoicing manually, which took up staff time and increased the likelihood of mistakes.
By bringing bookings, member management, billing and reporting into Nexudus, the team was able to streamline its everyday processes. Automated billing also helped reduce aged debt, while reporting gave staff clearer information to support their financial processes.
The team could spend less time on repetitive administration and more time focusing on its community


FuseBox: less manual reporting
Before Nexudus, FuseBox used Google Forms to track memberships and Google Sheets for billing. Their accountant had to follow up on unpaid invoices manually.
Over time, what began as a clever homemade setup became another job to manage.
With Nexudus, FuseBox replaced manual processes with connected bookings, billing, membership records and reporting. When the team wants to analyse its data, track trends or identify pain points, it can access that information through the platform rather than rebuilding it in spreadsheets.
Level39: cleaner data across the workspace
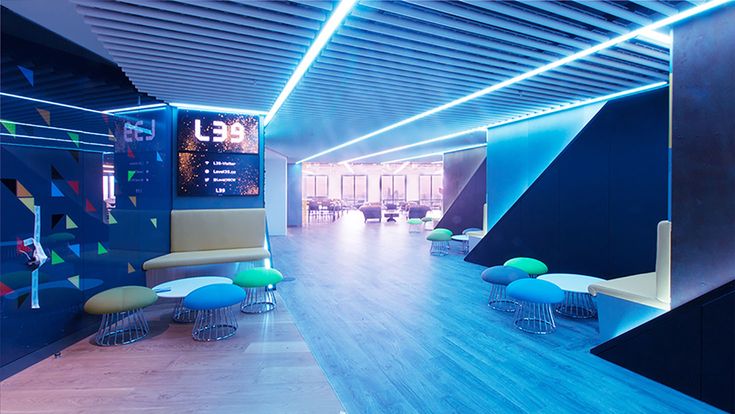
London-based technology hub Level39 required coworking software with APIs that could integrate with its existing systems and present information in a unified, easy-to-navigate format.
Nexudus brought digital member management, finance, resource management and email marketing under one roof. Staff could access cleaner data, while tracking and reporting provided a better view of what was happening across the workspace.
Automation also proved useful for member engagement. The team could set up workflows based on where a member was in the pipeline, such as sending an onboarding email when a membership became active.

Qaunain Meghjee
Head of Technology, Level 39
App-first member experience: the missing integration layer
Today’s coworking members want an app-first experience: the ability to book, communicate and interact with their workspace using their smart devices. But an app is only the visible part of the experience.
Behind it sit the bookings, payments, access permissions, member records and communications that keep everything running.
When those systems are disconnected, the member may see inaccurate availability, receive the wrong message or encounter an access problem that the front-of-house team has to resolve.
When they are connected, interactions in the member portal or app also contribute to a more complete view of how people are using the space.
Bookings show demand. Check-ins show attendance. Purchases show additional interests. Support requests reveal friction.
That is what turns an app from a convenient interface into a useful integration layer.
Is your data helping with key decisions?
Ultimately, analytics is about turning insights and statistics into strategic decisions that improve the member experience and drive return on investment.
Use these questions as a quick test:
- Do you know which resources are underutilised, and why?
- Can you easily see revenue by space type, resource or location?
- Are you tracking peak hours and adjusting pricing or staffing accordingly?
- Can you see what has been invoiced, paid and left overdue?
- Are you notified when members disengage or show signs of leaving?
- Do you use occupancy and utilisation data to inform layout decisions?
- Can leadership compare performance across locations?
- Does your pricing reflect demand?
- Are regular reports automated and sent to the people who need them?
- Does each report lead to a clear action or owner?
If the answer to several of these is no, your team is probably doing too much work around the data.
See your coworking business more clearly
Good analytics does not mean collecting every number available.
It means giving your team the information it needs to understand what is happening, why it matters and what to do next.
Nexudus gives operators a clearer view of performance across revenue, occupancy, bookings, retention and daily operations.
With Explore, Trends and Revenue Forecasts, teams can understand how their space is being used, where revenue is coming from, which members may need attention and what should happen next.

Want to know more about
how Nexudus could help your business?
We’re here to answer any questions you have.
Latest articles
-

- Coworking
- Coworking Resources
Practical AI Lessons for Coworking Operators from GWA Denver 2026
Damian on October 1, 2026 -

- Coworking
- Coworking News
- Technology
AI didn’t add a feature to coworking software. It’s rewriting what the product is.
Jane Robathan on September 30, 2026 -

- Coworking
Advanced Coworking Analytics: When Standard Reports Fall Short
Emily Nguyen on September 15, 2026