


- Coworking
Too Many Spreadsheets? 7 Signs Your Coworking Business Has Outgrown Them

TL;DR
We’re regularly (and genuinely) surprised by how many coworking operators we onboard who are using spreadsheets for almost everything.
And we get it. Spreadsheets are familiar, flexible and useful. They’re often the quickest way to organise information, investigate a question or put together a report.
There’s no reason to stop using them when they’re doing the job well.
But as your coworking business grows, some of the spreadsheets you’ve relied on can require more manual work to maintain. More locations, more teams and more reporting requirements can mean more exports, more versions and more time spent preparing information.
Here are seven signs it might be worth moving some of that work into your coworking reporting platform, while keeping spreadsheets for jobs they’re good at.
1. You export the same data every week or month
There are plenty of good reasons to export data.
You might need to send information to your accountant, carry out additional analysis or combine it with data from another system.
But if you’re downloading the same CSV every Monday or at the end of every month, it’s worth looking at what happens next.
Perhaps someone cleans up the file, applies the same filters, updates a pivot table and circulates the finished report. Then they repeat the process during the next reporting period.
If the question being answered is also the same each time, a dashboard, filtered report or scheduled report may be a better fit.
You can still export the data when you need to do something more with it. You just don’t need to start with a new CSV every time you want an updated number.
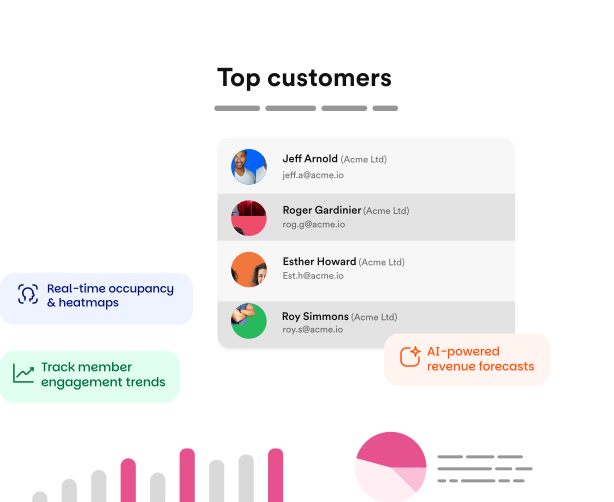

2. Different teams have their own versions of the same report
It’s quite normal for different teams to need different views of the same business.
Finance might care about invoices and payments. Operations may look at bookings and utilisation. Leadership might want revenue and occupancy across the business.
Spreadsheets can make it easy for each team to create the version they need. The trade-off is that you may end up maintaining several reports built from similar underlying information.
There’s also the practical question of which version someone should use when they need a number.
A shared reporting platform can give teams access to the same underlying data while allowing them to filter or report on the information relevant to their role.
3. Someone has to prepare the numbers before anyone else can use them
If a manager asks how occupancy is looking this month, can they check? Or does somebody need to export the data and update a spreadsheet first?
The same applies to questions about revenue, bookings, memberships, invoices or other regular measures of performance.
Some reports will always need some preparation or interpretation. But the information people use regularly should ideally be available without waiting for someone to produce it. This is particularly useful when different teams or locations need access to reporting at different times.
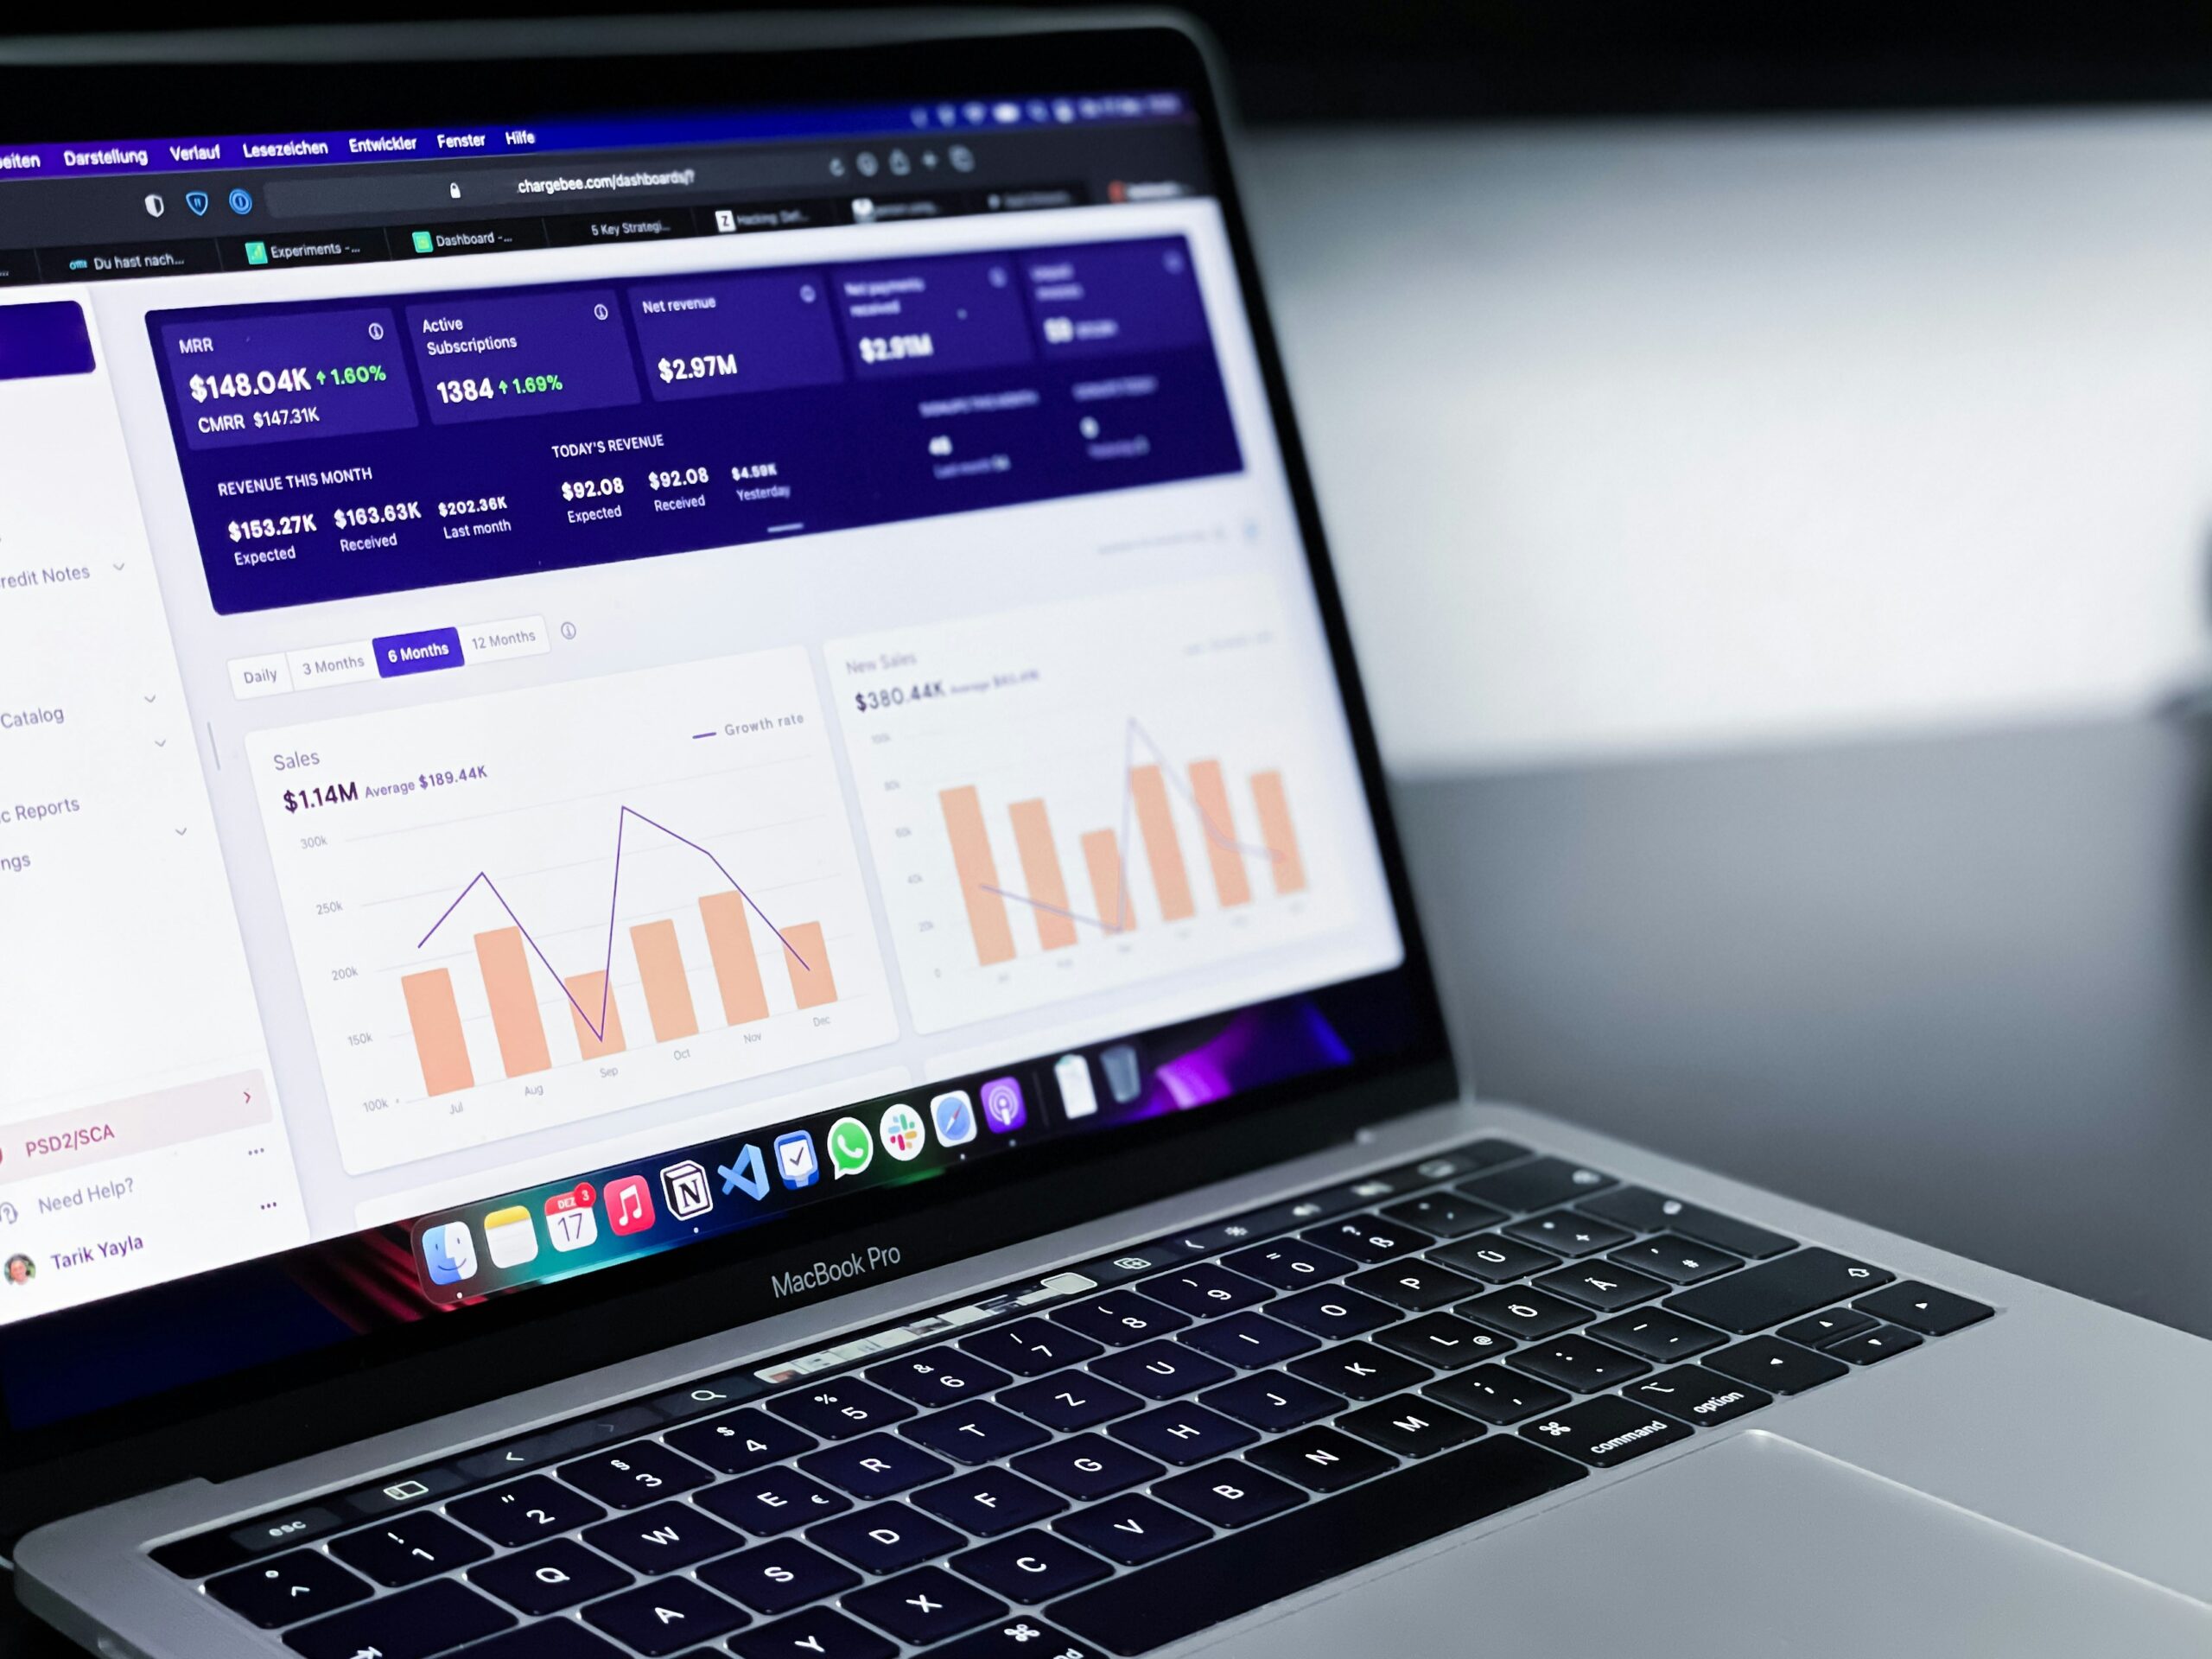
4. You’re combining data from several locations by hand
A spreadsheet can be a straightforward way to compare two locations. As you add more sites, the process can involve more files, filters and manual preparation.
Someone might export information for each location and bring it together into a group report. Or each local manager may maintain their own spreadsheet before sending the information to head office.
If your coworking platform already contains the data for each location, reporting across those locations can often happen there too.
That gives leadership a wider view of the business while still allowing local teams to focus on their own site. And if you want to carry out additional analysis across the portfolio, you can export the information afterwards.
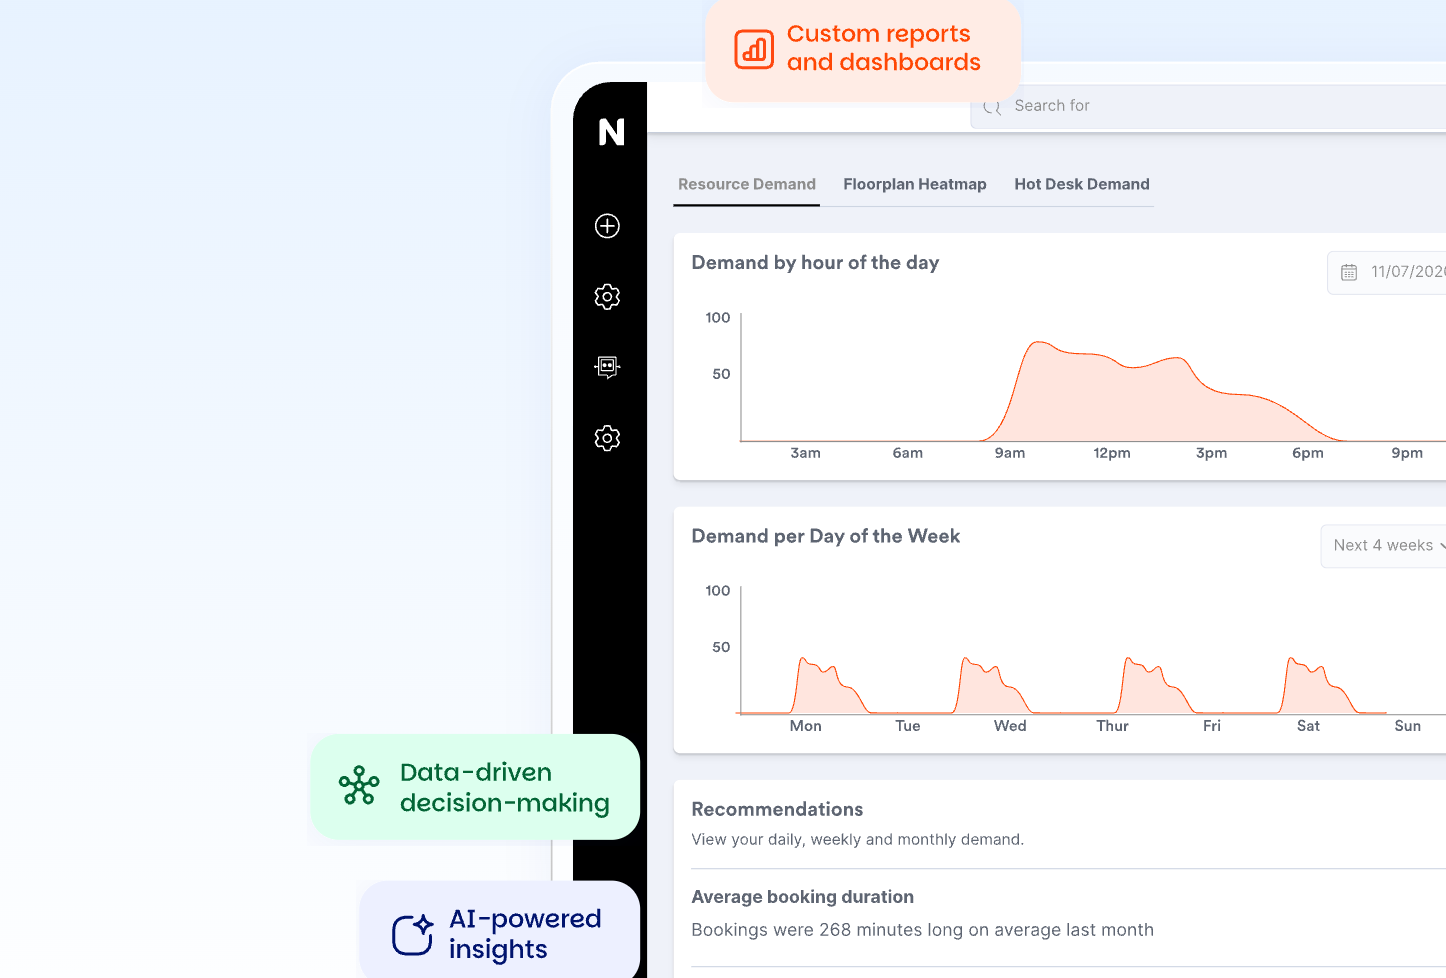
Preparing the report takes longer than it needs to
A monthly spreadsheet might only take 20 or 30 minutes to update, which seems perfectly reasonable. It really isn’t when you have several of them, or when the process involves a lot of repetitive preparation.
Downloading files. Removing columns. Checking date ranges. Updating formulas. Refreshing pivot tables. Copying charts into another document.
If those steps are necessary for the analysis you’re doing, a spreadsheet is probably still the right place for it. But if they’re preparation before you can see the same set of KPIs each month, there may be an easier way to get to the information.
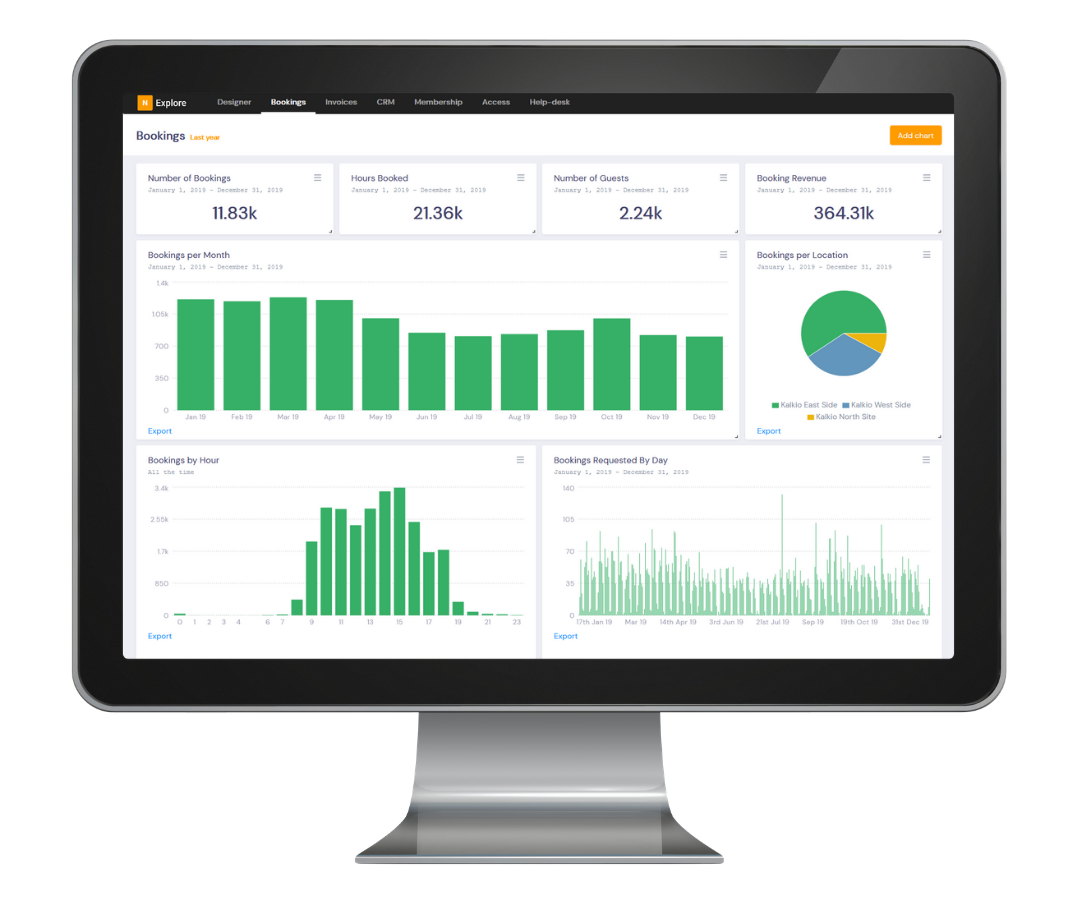
6. You’re using spreadsheets for basic operational questions
Some questions come up all the time in a coworking business.
- How many memberships do we have?
- How much revenue did we generate?
- What’s our occupancy?
- Which resources are being booked?
- Which invoices are overdue?
- How does this month compare with the last one?
You might want to take that information into a spreadsheet afterwards to investigate something further. But getting the initial answer shouldn’t necessarily require one.
Keeping regular operational reporting within your coworking platform means teams can get to the information first and decide whether further analysis is actually needed.
7. You want to use spreadsheets for analysis, not admin
This is probably the clearest test. Spreadsheets are very good at letting you work with data.
You can build forecasts, model different scenarios, combine datasets, create custom calculations and investigate questions that aren’t covered by your standard reports.
These are all great reasons to use one.
Repeatedly exporting and preparing information so that other people can see what happened last month is a different job.
A good reporting setup lets your coworking platform handle more of the routine reporting while still making the underlying data available when Excel, Google Sheets or a BI platform is the better tool.
So, have you actually outgrown spreadsheets?
Probably not entirely. And that isn’t really the goal.
Instead, look at the spreadsheets your team uses regularly and ask what each one is doing.
- Is it helping you analyse something?
- Is it combining information that genuinely needs to come from several systems?
- Is it giving you flexibility you don’t have elsewhere?
- Or is it recreating a view of information that already exists in your coworking platform?
Some spreadsheets will still be useful. Some may only need a few changes. Others may no longer need to be part of your regular reporting process.
How Nexudus Explore fits into this (that’s us)
Nexudus Explore gives teams access to dashboards and detailed reporting using the information already held in Nexudus.
You can use dashboards for a high-level view, filter information by areas such as location and move into the detail behind individual KPIs.
That means finance, operations, leadership and local teams can use the same underlying data without needing the same report prepared for each of them.
And spreadsheets don’t disappear from the process.
When you need to forecast, combine datasets or carry out further analysis, you can export the information and continue working with it elsewhere.
For more complex questions, advanced analytics can also help you examine patterns across different parts of your business.
The aim is fairly simple: use your reporting tools for the reporting they can already handle, and use spreadsheets when you actually need the flexibility of a spreadsheet.


Want to know more about
how Nexudus could help your business?
We’re here to answer any questions you have.
Latest articles
-

- Coworking
- Coworking Resources
Practical AI Lessons for Coworking Operators from GWA Denver 2026
Damian on October 1, 2026 -

- Coworking
- Coworking News
- Technology
AI didn’t add a feature to coworking software. It’s rewriting what the product is.
Jane Robathan on September 30, 2026 -

- Coworking
Advanced Coworking Analytics: When Standard Reports Fall Short
Emily Nguyen on September 15, 2026