


- Coworking
- Coworking Resources
What To Include In Your Monthly Coworking Report
TL;DR
A good monthly coworking report should show more than whether your space was busy, and the most useful reports group the right information into a repeatable structure.
A monthly coworking report should answer five questions:
- Is the business growing?
- Is revenue healthy?
- Is space being used well?
- Are members staying?
- What needs attention next month?
What should a monthly coworking report show?
A monthly report should give everyone reviewing the business the same starting point.
That means using the same reporting period, the same core definitions and a structure people can come back to each month.
For most coworking operators, a useful report will cover:
- Business overview
- Revenue and invoicing
- Occupancy and utilisation
- Bookings and resource demand
- Membership growth and retention
- Operations and engagement
- Actions for the next reporting period
The amount of detail you include in each section will depend on your business.
A single-site operator may only need a few headline measures. A larger business may need location comparisons, finance detail and additional reports sitting behind the main summary.
Either way, the report should make changes easy to spot. What moved? What stayed roughly the same? Is anything heading in the wrong direction? Is there something worth investigating further?
What should a monthly coworking report show?
A monthly report should give everyone reviewing the business the same starting point.
That means using the same reporting period, the same core definitions and a structure people can come back to each month.
For most coworking operators, a useful report will cover:
- Business overview
- Revenue and invoicing
- Occupancy and utilisation
- Bookings and resource demand
- Membership growth and retention
- Operations and engagement
- Actions for the next reporting period
The amount of detail you include in each section will depend on your business.
A single-site operator may only need a few headline measures. A larger business may need location comparisons, finance detail and additional reports sitting behind the main summary.
Either way, the report should make changes easy to spot. What moved? What stayed roughly the same? Is anything heading in the wrong direction? Is there something worth investigating further?

Start with the same reporting period every time
Before deciding which charts to include, get the basics of the reporting process consistent.
If one report covers a calendar month and the next covers the previous 30 days, comparisons quickly become difficult.
Choose the period your team will report against and stick with it.
For most operators, that might mean:
- Calendar month
- Previous month
- Same month last year
- Rolling three-month trend
- Rolling six- or twelve-month trend where useful
The right comparison depends on the question. Month-on-month figures show recent movement. Year-on-year comparisons can help account for seasonality. Longer trends make it easier to see whether a change is part of a wider pattern.
You should also agree the definitions behind the numbers. If one person calculates occupancy differently from another, or finance and operations are using different definitions of revenue, the report becomes harder to trust.
Document the core definitions once and use them consistently.
Build a one-page business overview
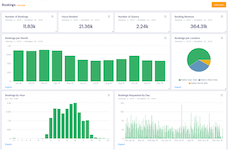
The first page should give a quick view of how the business performed during the reporting period.
You do not need every number available.
Choose a small group that covers the main areas of the business and helps the reader decide where to look next.
A typical summary might include:
- Total revenue
- Recurring membership revenue
- One-off revenue
- Occupancy
- RevPOD
- RevPAD
- Active members
- New and lost members
- Total bookings
- Overdue invoices
- Failed payments
Show the current figure alongside a useful comparison.
“Occupancy is 82%” provides the current position.
“Occupancy is 82%, down from 87% three months ago” immediately gives the team something to investigate.
The same applies to revenue, bookings, churn or overdue invoices.
Your overview should remain short enough to scan quickly. The sections that follow can explain anything that stands out.
Add the financial picture behind the headline
Your finance section should give enough information to understand how the business is earning and collecting revenue.
Start with the headline figures, then show any movement that needs attention.
Depending on your business model, that may include:
- Total revenue
- Recurring versus one-off revenue
- Invoiced revenue
- Paid invoices
- Overdue invoices
- Failed payments
- Refunds or credits
- Revenue by location, plan or product
Keep the focus on the reporting period.
If total revenue increased, what contributed to the change?
If recurring revenue stayed steady but one-off revenue fell, does that matter?
If invoiced revenue grew while overdue balances also increased, finance may need to look more closely at collection.
The detailed financial reports can sit behind the monthly pack. The main report should show the movement and enough context to decide whether anything needs follow-up.

Show how the space performed
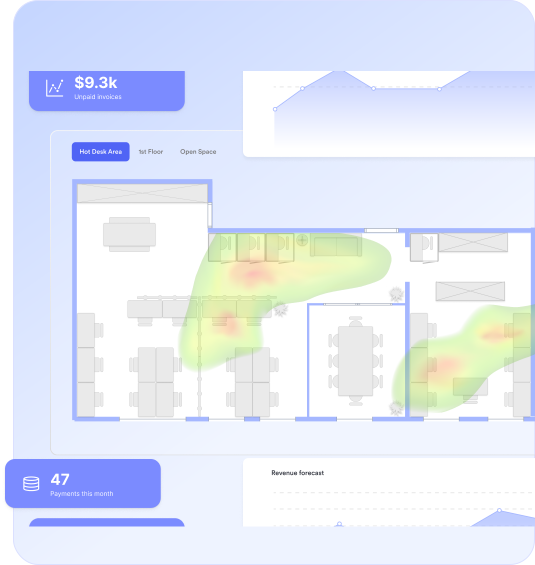
Occupancy and utilisation give you two useful views of your workspace.
Occupancy shows how much inventory is sold, assigned or occupied.
Utilisation shows how bookable resources are actually being used.
For your monthly report, you may want to include:
- Overall occupancy
- Desk or office occupancy
- Resource utilisation
- Occupied versus vacant inventory
- RevPOD
- RevPAD
Avoid adding every possible breakdown to the main report.
If overall occupancy has stayed stable, a headline figure may be enough.
If meeting room utilisation has dropped sharply, or one area is consistently underused, bring that into the report and investigate the detail behind it.
The same approach works with revenue efficiency. If occupancy is healthy but RevPAD is falling, that deserves more attention than another chart showing a stable occupancy rate.

Use bookings to show where demand is moving
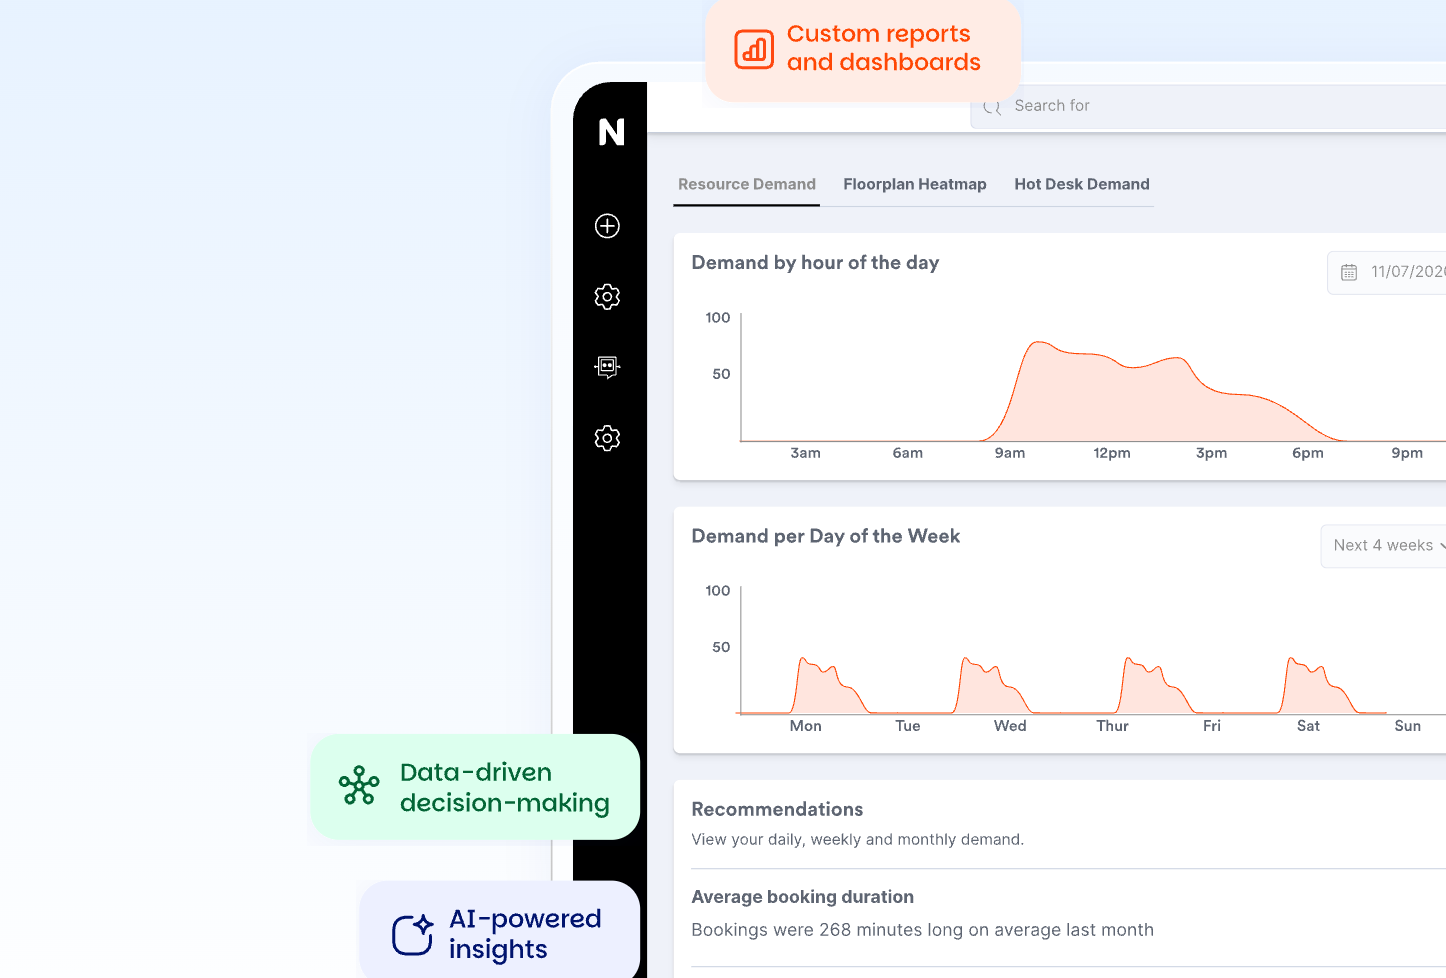
Bookings can help explain how customers are using the space and when demand is changing.
You can track:
- Total bookings
- Booking revenue
- Booking duration
- Bookings by weekday or hour
- Most-booked resources
- Cancellations
- No-shows
- Credits used
Your monthly report does not need to reproduce all of these. Surface the patterns that matter.
Perhaps meeting room bookings increased by 15%, with most of the growth happening in the mornings.
Perhaps a resource that used to be popular has seen three months of falling demand.
Perhaps no-shows have increased enough to justify reviewing your booking rules.
Those are useful monthly-report findings because they can lead to an operational or commercial action.
Put member growth and retention together
New member numbers can look positive on their own. Looking at new and lost members together gives you a better view of what happened during the period.
Your monthly membership section might include:
- Active members
- New members
- Lost members
- Net member growth
- New and terminated memberships
- Churn
- Revenue churn
- Average length of stay
- Plan performance
You may also use engagement data when it helps explain the movement. Falling bookings or check-ins among active members could give the community team a reason to look more closely at engagement.
Keep this section focused on changes.
If churn has stayed within its normal range, report it and move on.
If one membership plan or location shows a noticeable increase in cancellations, that’s worth surfacing.

Keep operational reporting selective
Coworking businesses generate plenty of day-to-day operational data. Check-ins, member logins, support tickets, orders, events and other activity can all be useful. They do not all need to appear in the monthly report.
Include operational information when it adds context to the wider picture.
For example:
- Check-ins are down while active membership is stable
- Support tickets have increased considerably
- Event participation has risen alongside member engagement
- Purchasing patterns have changed
- One location has unusually high support activity
Routine information can remain in the operational reports used by the relevant teams. This keeps the monthly pack readable and makes operational metrics more useful when they do appear.
If you have multiple sites, keep the main view comparable
Multi-location operators need to be able to compare locations without turning the monthly report into a separate pack for every site.
Start with the portfolio result. Then highlight locations where performance differs enough to warrant attention.
For example:
Portfolio occupancy remained at 84%. Birmingham increased four percentage points, while Leeds fell five points and has now declined for three consecutive periods.
The main report now tells you where to look. The local team can use the detailed reporting to understand what is happening in Leeds.
Consistent definitions become particularly important here. Every location should calculate the core measures in the same way if you want to compare them reliably.
Give each part of the report an owner
A monthly report becomes much easier to maintain when responsibility is clear.
- Finance may own revenue, invoicing and payment health.
- Operations may own occupancy, utilisation and bookings.
- Community teams may own membership activity and retention.
- A general manager or operator may pull those findings together into the overall business view.
Ownership doesn’t mean each team needs to create another presentation. It means somebody is responsible for checking the numbers, understanding significant movement and bringing useful context into the report.
This also reduces the end-of-month scramble where one person has to collect explanations from several teams after the report has already been assembled.
Turn it into a monthly reporting rhythm
The report itself is only one part of the process. A consistent monthly rhythm makes it easier to prepare and gives teams regular points to review their area of the business. Here’s how that could look.
Finance close
Review revenue, invoices, payments, overdue balances and any material credits or refunds.
Operational review
Look at occupancy, utilisation, bookings, check-ins and anything unusual in day-to-day activity.
Membership review
Check member growth, cancellations, churn and engagement signals.
Business review
Bring the main findings together. Compare them with the previous period and decide what needs to be included in the report.
Action review
Agree the small number of things the team will follow up during the next reporting period.
The exact timing can fit your business. The important part is that reporting becomes repeatable rather than something that has to be recreated at the end of every month.
Example monthly coworking report template
A simple monthly report could follow this structure.
Page 1: Business overview
Show the headline measures for the period and their comparison with the previous period or relevant trend.
Include the few measures that give the clearest overall view of the business.
Page 2: Revenue and invoicing
Explain meaningful changes in revenue mix, invoicing, payment health and overdue balances.
Keep detailed invoice records outside the main pack unless they are needed to explain an issue.
Page 3: Space and demand
Bring occupancy, utilisation and the most useful booking patterns together.
Highlight resources or periods where performance changed enough to warrant action.
Page 4: Membership and retention
Show active, new and lost members together with churn and any engagement signals that help explain the result.
Page 5: Actions for the next reporting period
Finish with a short action list.
For each action, include:
- The finding
- Why it needs attention
- The next step
- The owner
- When it will be reviewed again
Three to five actions will usually be easier to manage than a long list covering every observation in the report. Like this, reporting becomes management.
| Finding | Why it matters | Action | Owner |
| Meeting room utilisation is low on Fridays | Underused capacity | Test a Friday package | Operations / Marketing |
| Overdue invoices increased | More cash remains outstanding | Review failed payments and follow up | Finance |
| Churn rose in one location | Retention needs investigation | Review affected plans and member activity | General Manager / Community |
| High occupancy but weak RevPAD | Revenue efficiency needs review | Review pricing, discounts and space mix | General Manager / Finance |

Close the reporting cycle with actions
The final part of the process is checking whether the previous report led to anything.
- Bring last month’s actions back into the next review.
- Was the overdue balance reduced?
- Did the pricing test change Friday meeting room demand?
- Did the team contact the member group showing lower engagement?
- Did the occupancy issue continue?
This gives the report continuity and makes it easier to see whether decisions had the intended result.
Some actions will be completed, others will continue, and you’ll find actions that may turn out not to matter as much as you expected.

How Nexudus Explore helps with monthly reporting
Explore can support this kind of recurring reporting process using the operational data already held in Nexudus.
Dashboards and detailed reports are brought into the same reporting experience across areas including revenue, invoices, occupancy, bookings, memberships and retention.
For a monthly report, teams can start with a high-level view and then move into the detailed reporting where a figure needs more explanation.
Fixed date ranges make it easier to keep reporting periods consistent. Drill-downs can help teams investigate the records behind a result, while reports can also be exported to PDF or Excel when needed.
Scheduled email and PDF delivery can help distribute regular reports without someone having to remember to send the same information each period.
For users with more advanced requirements, Explore Pro adds custom report building along with the ability to create, edit and save dashboards.
This means different teams can work at the level they need. Finance can spend more time with revenue and invoice data. Operations can investigate space and booking performance. The person assembling the monthly report can bring the relevant findings back into one regular view of the business.
Monthly reporting checklist
Before closing the report, check:
- Are we using the same reporting period as last month?
- Are the core metrics defined consistently?
- Can someone understand the overall month from the first page?
- Have we compared the figures with a useful previous period or trend?
- Have we explained the changes that matter?
- Are detailed reports sitting behind the summary where needed?
- Does each reporting area have an owner?
- Have we kept routine operational detail out of the main pack?
- Have we reviewed last month’s actions?
- Does the report finish with clear actions for the next period?
A good reporting process should become easier to repeat over time.
Once the structure, definitions and ownership are established, each month becomes less about assembling the report and more about understanding what changed.
Build a consistent reporting process with Explore
Your monthly coworking report should give teams a regular view of the business and make changes easier to investigate.
Explore gives operators dashboards and detailed reporting across the core areas of a coworking business, with tools to filter, investigate, export and share the information teams need.
Want to know more about
how Nexudus could help your business?
We’re here to answer any questions you have.
Latest articles
-

- Coworking
- Technology
Nexudus AI Agents: The Different Types and What They Do
Emily Nguyen on October 12, 2026 -

- Coworking
- Coworking Resources
Practical AI Lessons for Coworking Operators from GWA Denver 2026
Damian on October 1, 2026 -

- Coworking
- Coworking News
- Technology
AI didn’t add a feature to coworking software. It’s rewriting what the product is.
Jane Robathan on September 30, 2026