


- Coworking
- Coworking Resources
Occupancy vs Utilisation: What Coworking Operators Need to Measure

TLDR
Occupancy and utilisation measure two different aspects of workspace performance. Occupancy shows how much of your inventory has been sold, while utilisation reveals how much it’s actually being used. Understanding both gives coworking operators a clearer picture of demand, pricing opportunities and operational efficiency, leading to better business decisions.
A coworking space can look full and still have a utilisation problem.
A private office may be occupied all month, but priced below its potential. A meeting room might be fully booked every Tuesday morning but sit empty for the rest of the week. Your hot desk area may feel crowded at 10 am, and still have spare capacity across the month.
That’s why coworking operators need to understand the difference between occupancy and utilisation.
Although the terms are often used interchangeably, they answer two very different questions. Occupancy tells you how much of your inventory has been sold or assigned. Utilisation tells you how much of your bookable space is actually being used.
Looking at only one metric can lead to misleading conclusions. Looking at both gives you a much clearer picture of how your workspace is performing, helping you make better decisions about pricing, operations, investment and growth.


The simple difference between occupancy and utilisation
At their simplest, the two metrics can be defined like this:
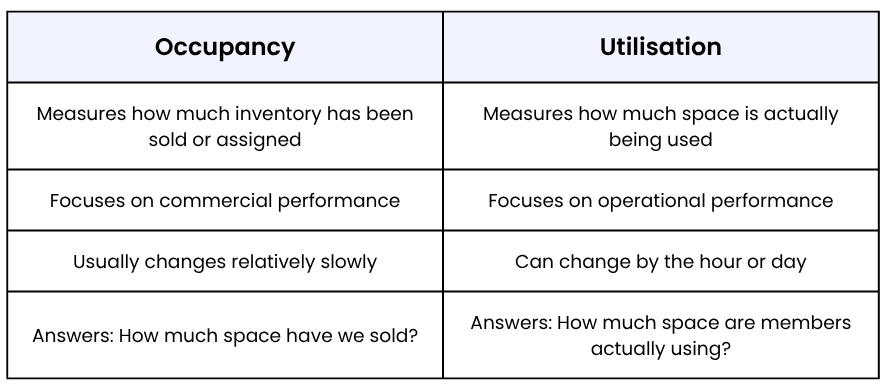
Here’s what that looks like in practice:
- A private office leased to a five-person company is occupied, whether the team comes in every day or only once a week.
- A meeting room available for 50 hours each week but booked for only 20 has a 40% utilisation rate.
- A dedicated desk may be assigned to a member all month, but if they only work from it twice a week, its utilisation is much lower.
- A hot desk area might have strong membership occupancy while still seeing uneven utilisation throughout the week.
Occupancy measures what’s been sold. Utilisation measures what’s actually happening.
What occupancy tells you
Occupancy is fundamentally a commercial metric. It tells you whether you’re selling enough of your available inventory and whether that inventory is generating the return you expect.
For private offices, occupancy shows how much of your office stock is leased and how much remains vacant. For dedicated desks, it reveals how many workstations are assigned compared with those still available. Looking across an entire workspace, occupancy helps operators understand how effectively they’re monetising their assets.
It also provides the foundation for more advanced commercial metrics. Revenue occupancy, list price attainment, revenue per occupied desk (RevPOD) and revenue per available desk (RevPAD) all build on occupancy data to show whether space is delivering its full earning potential.
This becomes especially valuable when comparing locations or resource types. Two coworking spaces might both report 90% occupancy, but if one consistently achieves higher revenue per occupied desk or office, it may indicate stronger pricing, a better mix of products or healthier demand.
In other words, occupancy helps answer the commercial question:
“How much of our workspace have we successfully sold?”
What utilisation tells you
Utilisation shifts the focus from sales to behaviour. Instead of measuring what’s been assigned, it measures how members actually use your workspace.
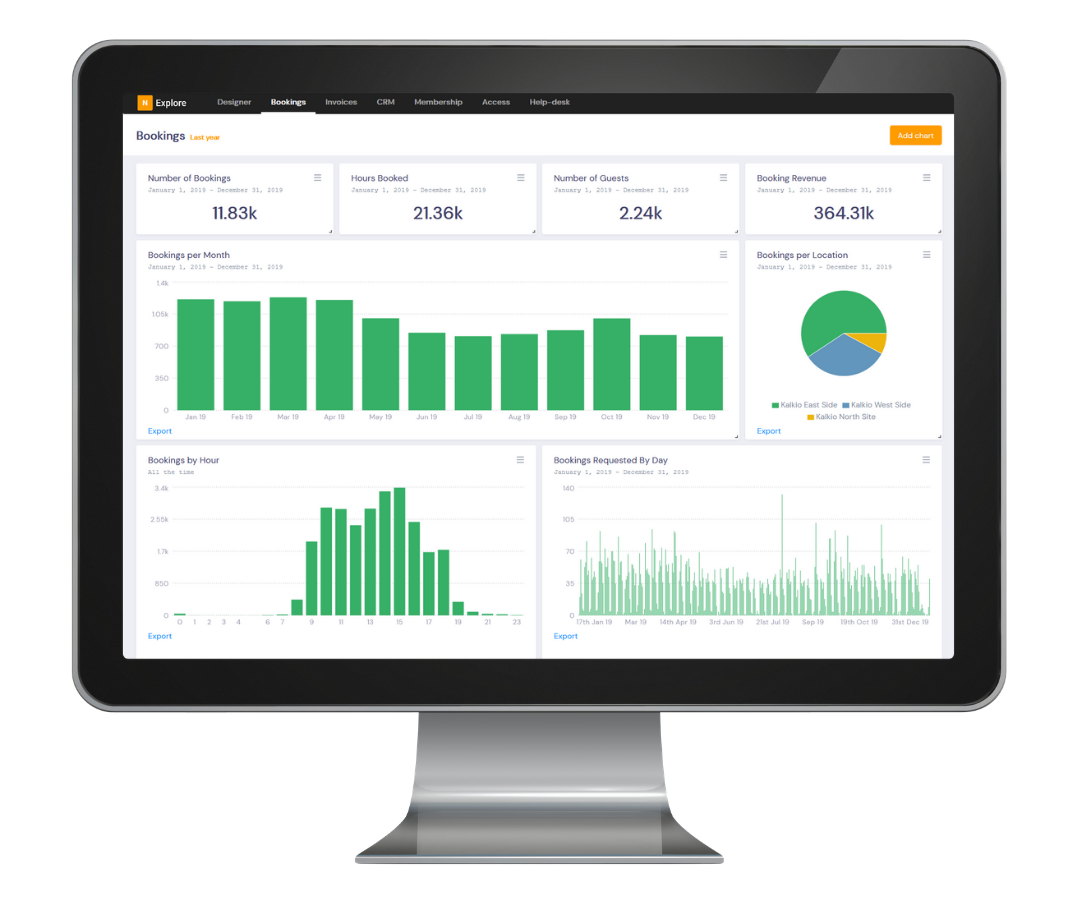
For bookable resources such as meeting rooms, utilisation is typically calculated by comparing booked time with the hours that resource is available. The same principle can be applied to desks, event spaces, phone booths, parking and other shared facilities.
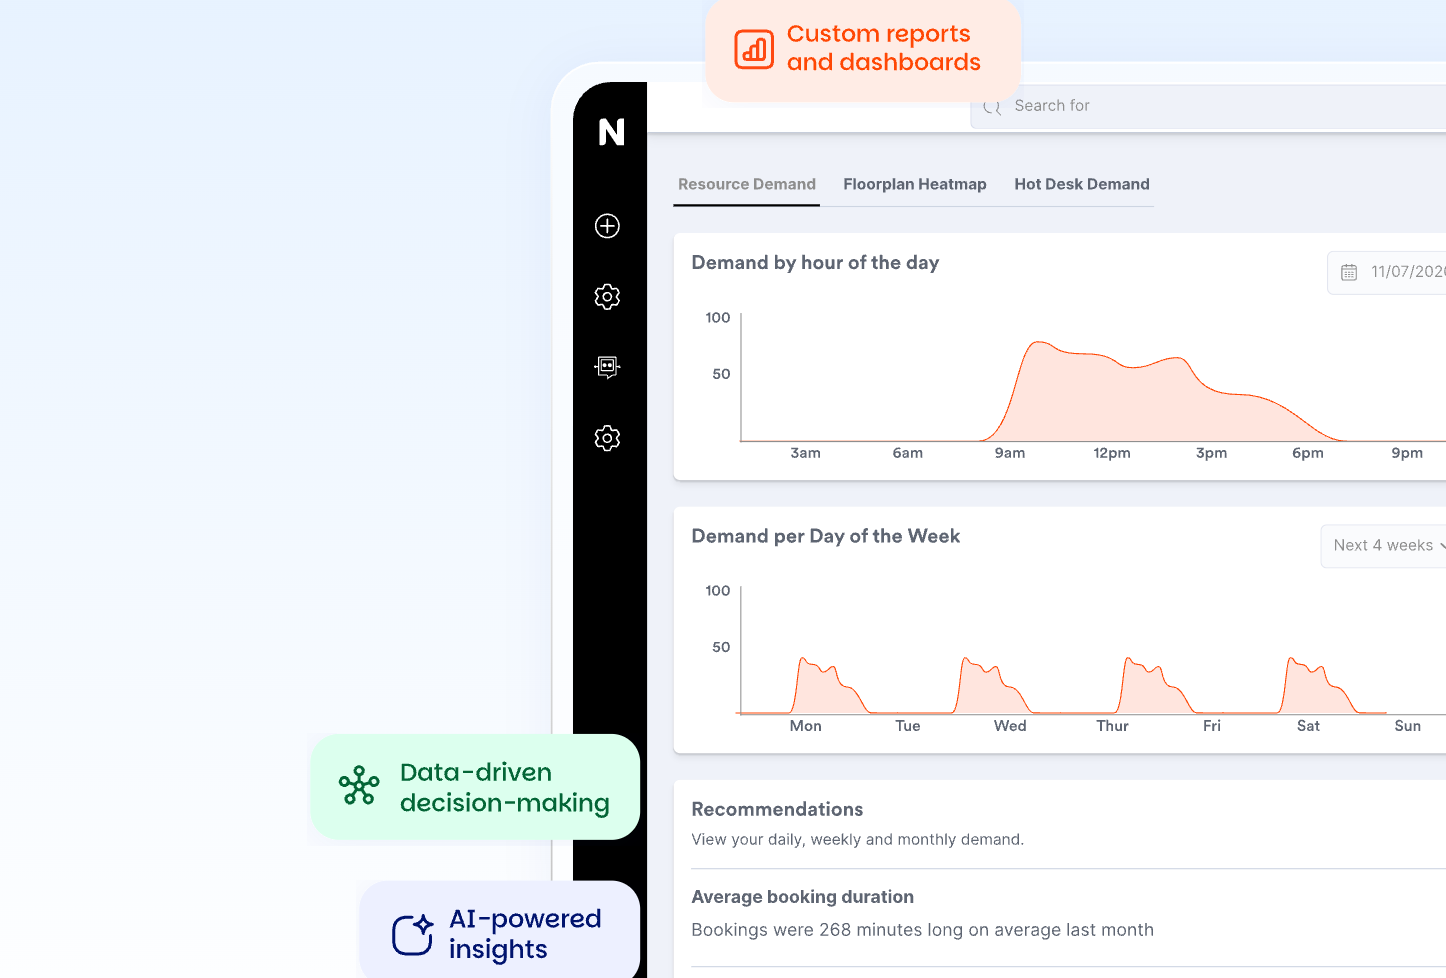
Unlike occupancy, utilisation changes constantly. It reflects how demand fluctuates throughout the day, across the week and over longer periods.
These patterns often reveal opportunities that occupancy alone cannot. You might discover that meeting rooms are consistently booked on Tuesday mornings but remain empty on Fridays, or that hot desks feel busy at certain times despite having plenty of spare capacity overall.
Modern coworking reporting also looks beyond bookings themselves. No-shows, cancellations and recurring booking patterns all provide valuable context, helping operators understand whether demand is genuine or simply appears high on paper.
Ultimately, utilisation answers the operational question:
“How much are our spaces actually being used?”
Why coworking operators need both
Neither metric tells the whole story.
Imagine your private offices are 95% occupied. At first glance, that’s an excellent result. But utilisation data shows that many teams only come into the office one or two days each week. That insight could influence future product strategy, suggesting demand for more flexible office plans rather than additional office space.
The opposite situation can be just as revealing. A meeting room suite may have relatively low occupancy because the rooms aren’t permanently assigned, yet utilisation could be extremely high because they’re booked almost constantly. That’s a strong signal that demand is outstripping supply, or that pricing could be increased.
Revenue adds another important layer. A resource that’s heavily utilised but generates relatively little income may simply be underpriced. Meanwhile, a resource with consistently low utilisation despite high availability might need different booking rules, better promotion or a completely different purpose.
When occupancy, utilisation and revenue are analysed together, operators gain a far more complete understanding of workspace performance than any single metric can provide.
How occupancy and utilisation affect decisions
The value of these metrics extends well beyond reporting—they influence decisions across the business.
Leadership teams use occupancy and utilisation trends to decide when it’s time to expand, reconfigure space or review pricing. Operations teams rely on them to optimise booking rules, opening hours and staffing levels based on actual demand. Sales teams can identify which membership plans, offices and resources are easiest to sell, while finance teams compare occupied inventory against revenue to ensure every asset is delivering an appropriate return.
Community managers also benefit. Understanding how members actually use the spaces they pay for helps shape programming, communications and future workspace improvements.
Viewed together, occupancy and utilisation become strategic metrics rather than simple operational reports.

Common reporting mistakes
Some of the most common reporting mistakes include:
- Treating occupancy and utilisation as the same metric.
- Looking only at monthly averages instead of daily or hourly patterns.
- Ignoring peak demand throughout the day.
- Measuring bookings without accounting for no-shows or cancellations.
- Reporting occupancy without considering revenue.
- Comparing locations without using consistent definitions.
Avoiding these pitfalls leads to reporting that’s far more useful and far more actionable.
What to measure by resource type
Different resources should be measured differently.
For private offices, occupancy is often the primary commercial indicator. Tracking occupancy alongside revenue occupancy, list price attainment, RevPOD and RevPAD helps operators understand not only how much office inventory has been sold but also how efficiently it’s generating revenue.
For dedicated desks, the focus is usually on occupied versus vacant inventory and the revenue generated by each desk. Because these resources are assigned to individual members, utilisation is generally less important than occupancy.
Hot desks tell a different story. Membership sales provide part of the picture, but bookings, check-ins and utilisation reveal when demand actually occurs and whether capacity is being used efficiently throughout the week.
With meeting rooms, utilisation becomes one of the most valuable performance indicators. Booked hours, available hours, booking revenue, average booking duration and no-show rates all help operators understand whether these resources are being managed effectively.
Other resources, such as parking spaces, podcast studios or event areas, should typically be evaluated using a combination of utilisation, revenue and repeat usage to understand both demand and profitability.
How Nexudus Explore helps operators see both
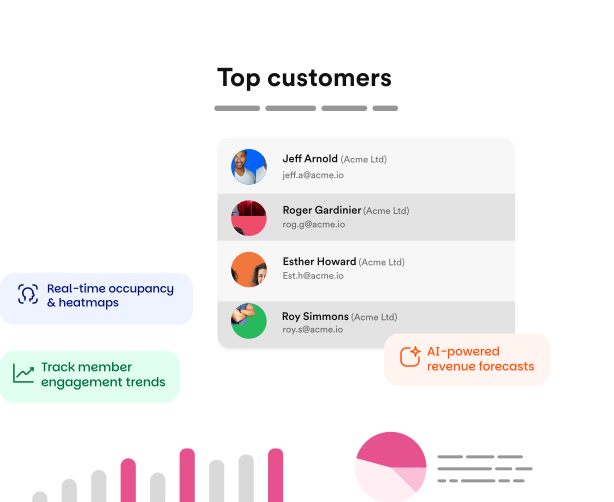
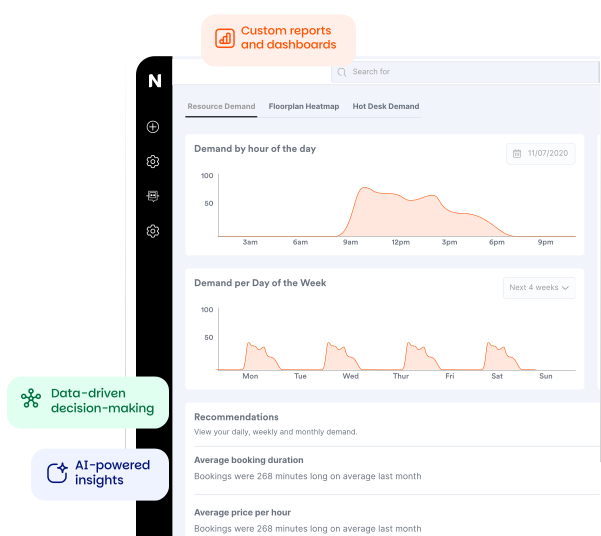
Nexudus Explore brings occupancy, utilisation and revenue reporting together in one place, making it easier to understand how your workspace is performing from every angle.
With Explore, operators can:
- Monitor occupancy dashboards across desks, offices and other resources.
- Analyse workplace usage through desk and space utilisation dashboards.
- Filter reports by location, resource type and time period.
- Track revenue efficiency alongside occupancy metrics.
- Drill into detailed reports behind every dashboard.
- Export data or schedule reports for leadership and finance teams.
Instead of switching between multiple reports, Explore helps you connect commercial performance with real-world usage, making it easier to identify opportunities and act on them.
Occupancy and utilisation checklist
Ask yourself:
- Do you know what percentage of your desks or offices are occupied?
- Do you know how often your bookable resources are actually being used?
- Can you compare occupancy and utilisation across multiple locations?
- Can you see whether your highest-demand resources are generating enough revenue?
- Can you identify recurring no-shows or underused spaces?
- Can you report on occupancy, utilisation and revenue together?
If not, there’s probably valuable insight missing from your reporting.
Occupancy and utilisation work best together
Occupancy and utilisation aren’t competing metrics – they complement each other.
Occupancy tells you whether you’re selling your workspace effectively. Utilisation tells you whether members are using it effectively. Together, they provide the context needed to optimise pricing, improve operations, plan future investment and maximise the value of every square metre.
If you want to see occupancy, utilisation and revenue in one reporting layer, Nexudus Explore gives coworking operators the tools to understand how their workspace is performing and where the biggest opportunities for improvement lie.
Want to know more about
how Nexudus could help your business?
We’re here to answer any questions you have.
Latest articles
-

- Coworking
- Coworking Resources
Practical AI Lessons for Coworking Operators from GWA Denver 2026
Damian on October 1, 2026 -

- Coworking
- Coworking News
- Technology
AI didn’t add a feature to coworking software. It’s rewriting what the product is.
Jane Robathan on September 30, 2026 -
- Coworking
Advanced Coworking Analytics: When Standard Reports Fall Short
Emily Nguyen on September 15, 2026