


- Coworking
Advanced Coworking Analytics: When Standard Reports Fall Short

TL;DR
Standard reports work well for common questions, but growing coworking businesses often need more flexibility to dig into their data.
Advanced coworking analytics helps operators compare locations, investigate KPIs and create reports around the questions that matter to their business. With Explore, teams can build custom reports, drill into data, filter dashboards and schedule reporting without relying on spreadsheets.
Standard reports are useful because they answer the questions most coworking operators ask every week.
How much revenue came in? Which invoices are overdue? How many bookings were made? Which spaces are occupied? How many members joined or left?
But as a coworking business grows, the questions become more layered. Operators need to compare locations, segment members, understand revenue quality, drill into bookings, monitor retention and share different views with different teams.
That is where advanced coworking analytics becomes useful.
It is not about having more charts for the sake of it but it is about having the flexibility to ask more specific questions of your data and get answers you can use.
What standard coworking reports are good for
There is a reason standard reports remain a core part of day-to-day reporting.
Pre-built reports give teams a quick way to check common KPIs, monitor performance and maintain a consistent view of what is happening across the business.
They are particularly useful for everyday reporting, quick checks and regular team updates. Finance teams can use them for invoice and revenue summaries, while operations teams might rely on booking or occupancy reports to understand what is happening across their spaces. Membership reports can provide a straightforward view of joins, cancellations and other changes.
For these common questions, a standard report can be exactly what you need.
Standard reports work best when the question is common, the format is fixed and you need a quick, consistent way to answer it.
The challenge starts when the questions require more depth.
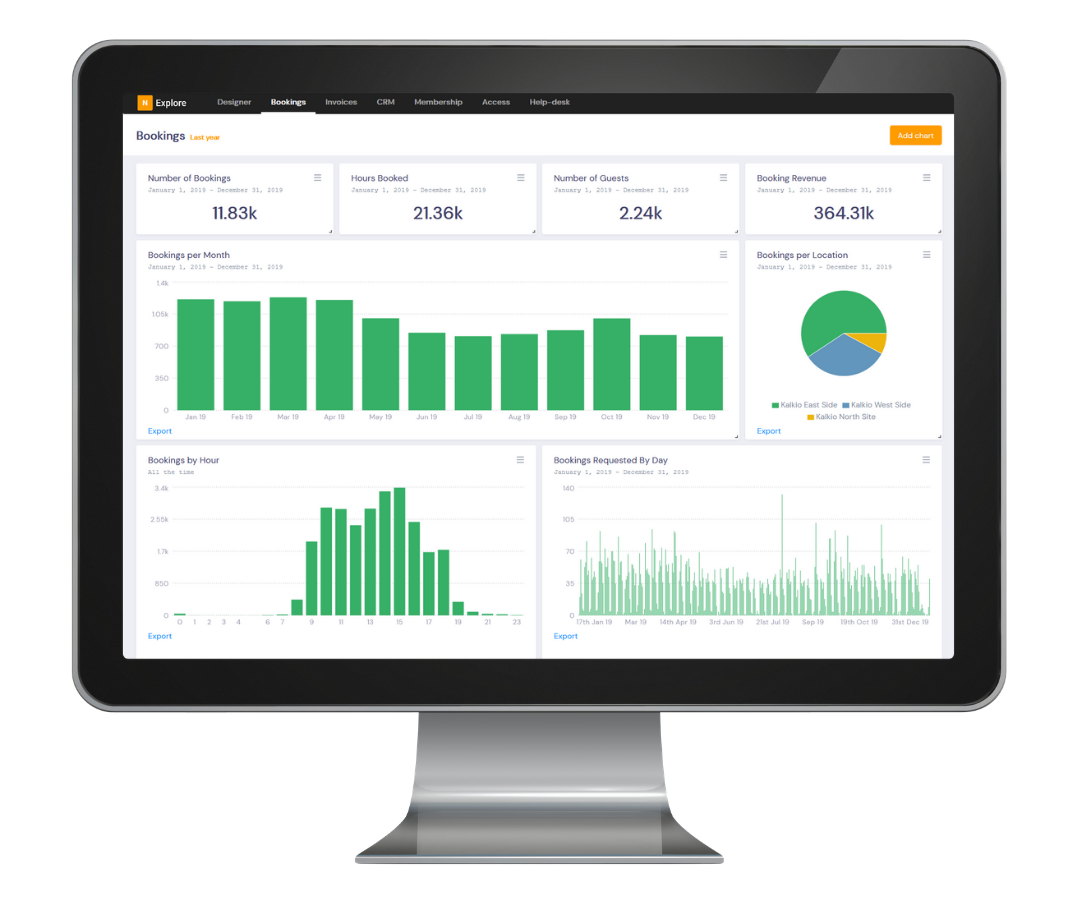
Where standard reports start to feel limited
Standard reports work well for straightforward questions. But when you need to compare, filter, or dig deeper into the data, they can start to feel restrictive.
You might have the information you need, but not in the format you need it in. You may have to work around fixed columns, limited filters or restricted date comparisons. Comparing several locations can mean exporting multiple reports and bringing them together in a spreadsheet.
Then there is the question of context.
A dashboard might show that occupancy is increasing, for example. But what happens when you want to know which resources are driving that increase, which customer types are using them, and whether that additional occupancy is translating into revenue?
This is where standard reporting can start to feel limiting.
The same thing happens when a report needs to be slightly different for every team. Finance might need customer balances and invoice data, while operations is more interested in resource utilisation. Leadership may want a high-level view across every location.
If each version has to be exported, edited and rebuilt manually, reporting becomes a task in itself.
The problem usually appears when the question changes slightly. The standard report gets you close, then the spreadsheet work begins.
Signs your team needs advanced analytics
You don’t necessarily need advanced analytics just because you have a lot of data.
The need usually becomes clear when reporting starts taking too much manual work or when your teams are asking questions that standard reports weren’t designed to answer.
If someone is exporting the same report every week, cleaning it up and adding their own calculations before sharing it, that’s one sign. If finance, operations and leadership each maintain their own spreadsheets, you may also be spending time reconciling different versions of the same information.
Growth can make these problems more obvious. Comparing two locations is relatively straightforward. Comparing ten, twenty or more can require considerably more work, particularly when you want to break the data down by membership plan, customer type, resource or time period.
There is also a difference between knowing what happened and understanding why.
A KPI might tell you that occupancy has fallen. A more flexible report can help you investigate whether that change is concentrated in a particular location, resource, membership type or period.
And when the same information needs to reach different teams every week or month, being able to schedule reports can remove another layer of manual work.

The questions advanced coworking analytics can answer
The value of advanced analytics comes down to the questions it lets you ask.
Take revenue. Total revenue is an important number, but it doesn’t necessarily tell you where performance is coming from. You might want to compare recurring revenue across locations, understand which products are driving one-off revenue, or identify whether particular plans are generating strong revenue but poor retention.
The same applies to occupancy. A space can be busy without necessarily performing well financially. Looking at occupancy alongside revenue can help operators identify resources that are heavily used but generating less value than expected. You might also want to understand when demand is strongest by day, hour or location.
Booking data can reveal another layer of operational detail. Instead of simply looking at how many bookings were made, you could investigate which resources have the most no-shows, which booking sources generate the most revenue, or which customers and teams book most frequently.
Membership data can be just as revealing. Looking beyond total joins and cancellations can help operators understand which plans have the highest churn, where engagement is falling, and which types of members tend to stay longest.
Not every question needs its own report. What matters is being able to have enough flexibility to investigate the questions that matter to your business.

What should advanced analytics let you do?
Advanced reporting should make it easier to move between a high-level view and the detail behind it.
That starts with the ability to filter data in ways that reflect how a coworking business operates. Location, date, company, customer, resource and plan can all provide useful ways to segment performance.
From there, teams should be able to drill into the records behind a KPI rather than treating a headline number as the end of the analysis.
Flexibility also matters in how information is presented. Being able to change columns, views or chart types means teams can adapt reporting to the question they’re trying to answer rather than working around a fixed format.
For recurring reporting, exporting data and scheduling reports can make it easier to share information with the people who need it. And when a dashboard already contains the right starting point, being able to duplicate and adapt it can save teams from rebuilding their reporting from scratch.
Ultimately, advanced reporting should give teams more control without making everyday reporting unnecessarily complicated.

Standard reports, custom reports or external BI tools?
For more mature operators, there isn’t necessarily one answer.
Standard reports are best for common questions and repeatable reporting. They’re quick, familiar and useful for the metrics teams check regularly.
Custom reports become more useful when teams need tailored views, additional filters, custom fields or dashboards built around the way their business operates.
External BI tools can make sense for larger organisations that need to combine coworking data with information from other systems, such as finance, marketing or investor reporting.
But not every operator needs a full business intelligence setup.
Many reporting questions can be answered in the system where the underlying bookings, billing, memberships and operational data already live. Moving data between multiple systems can add another layer of work when the information you need is already available in your coworking management platform.
The important thing is choosing the right level of reporting for the question you’re trying to answer.
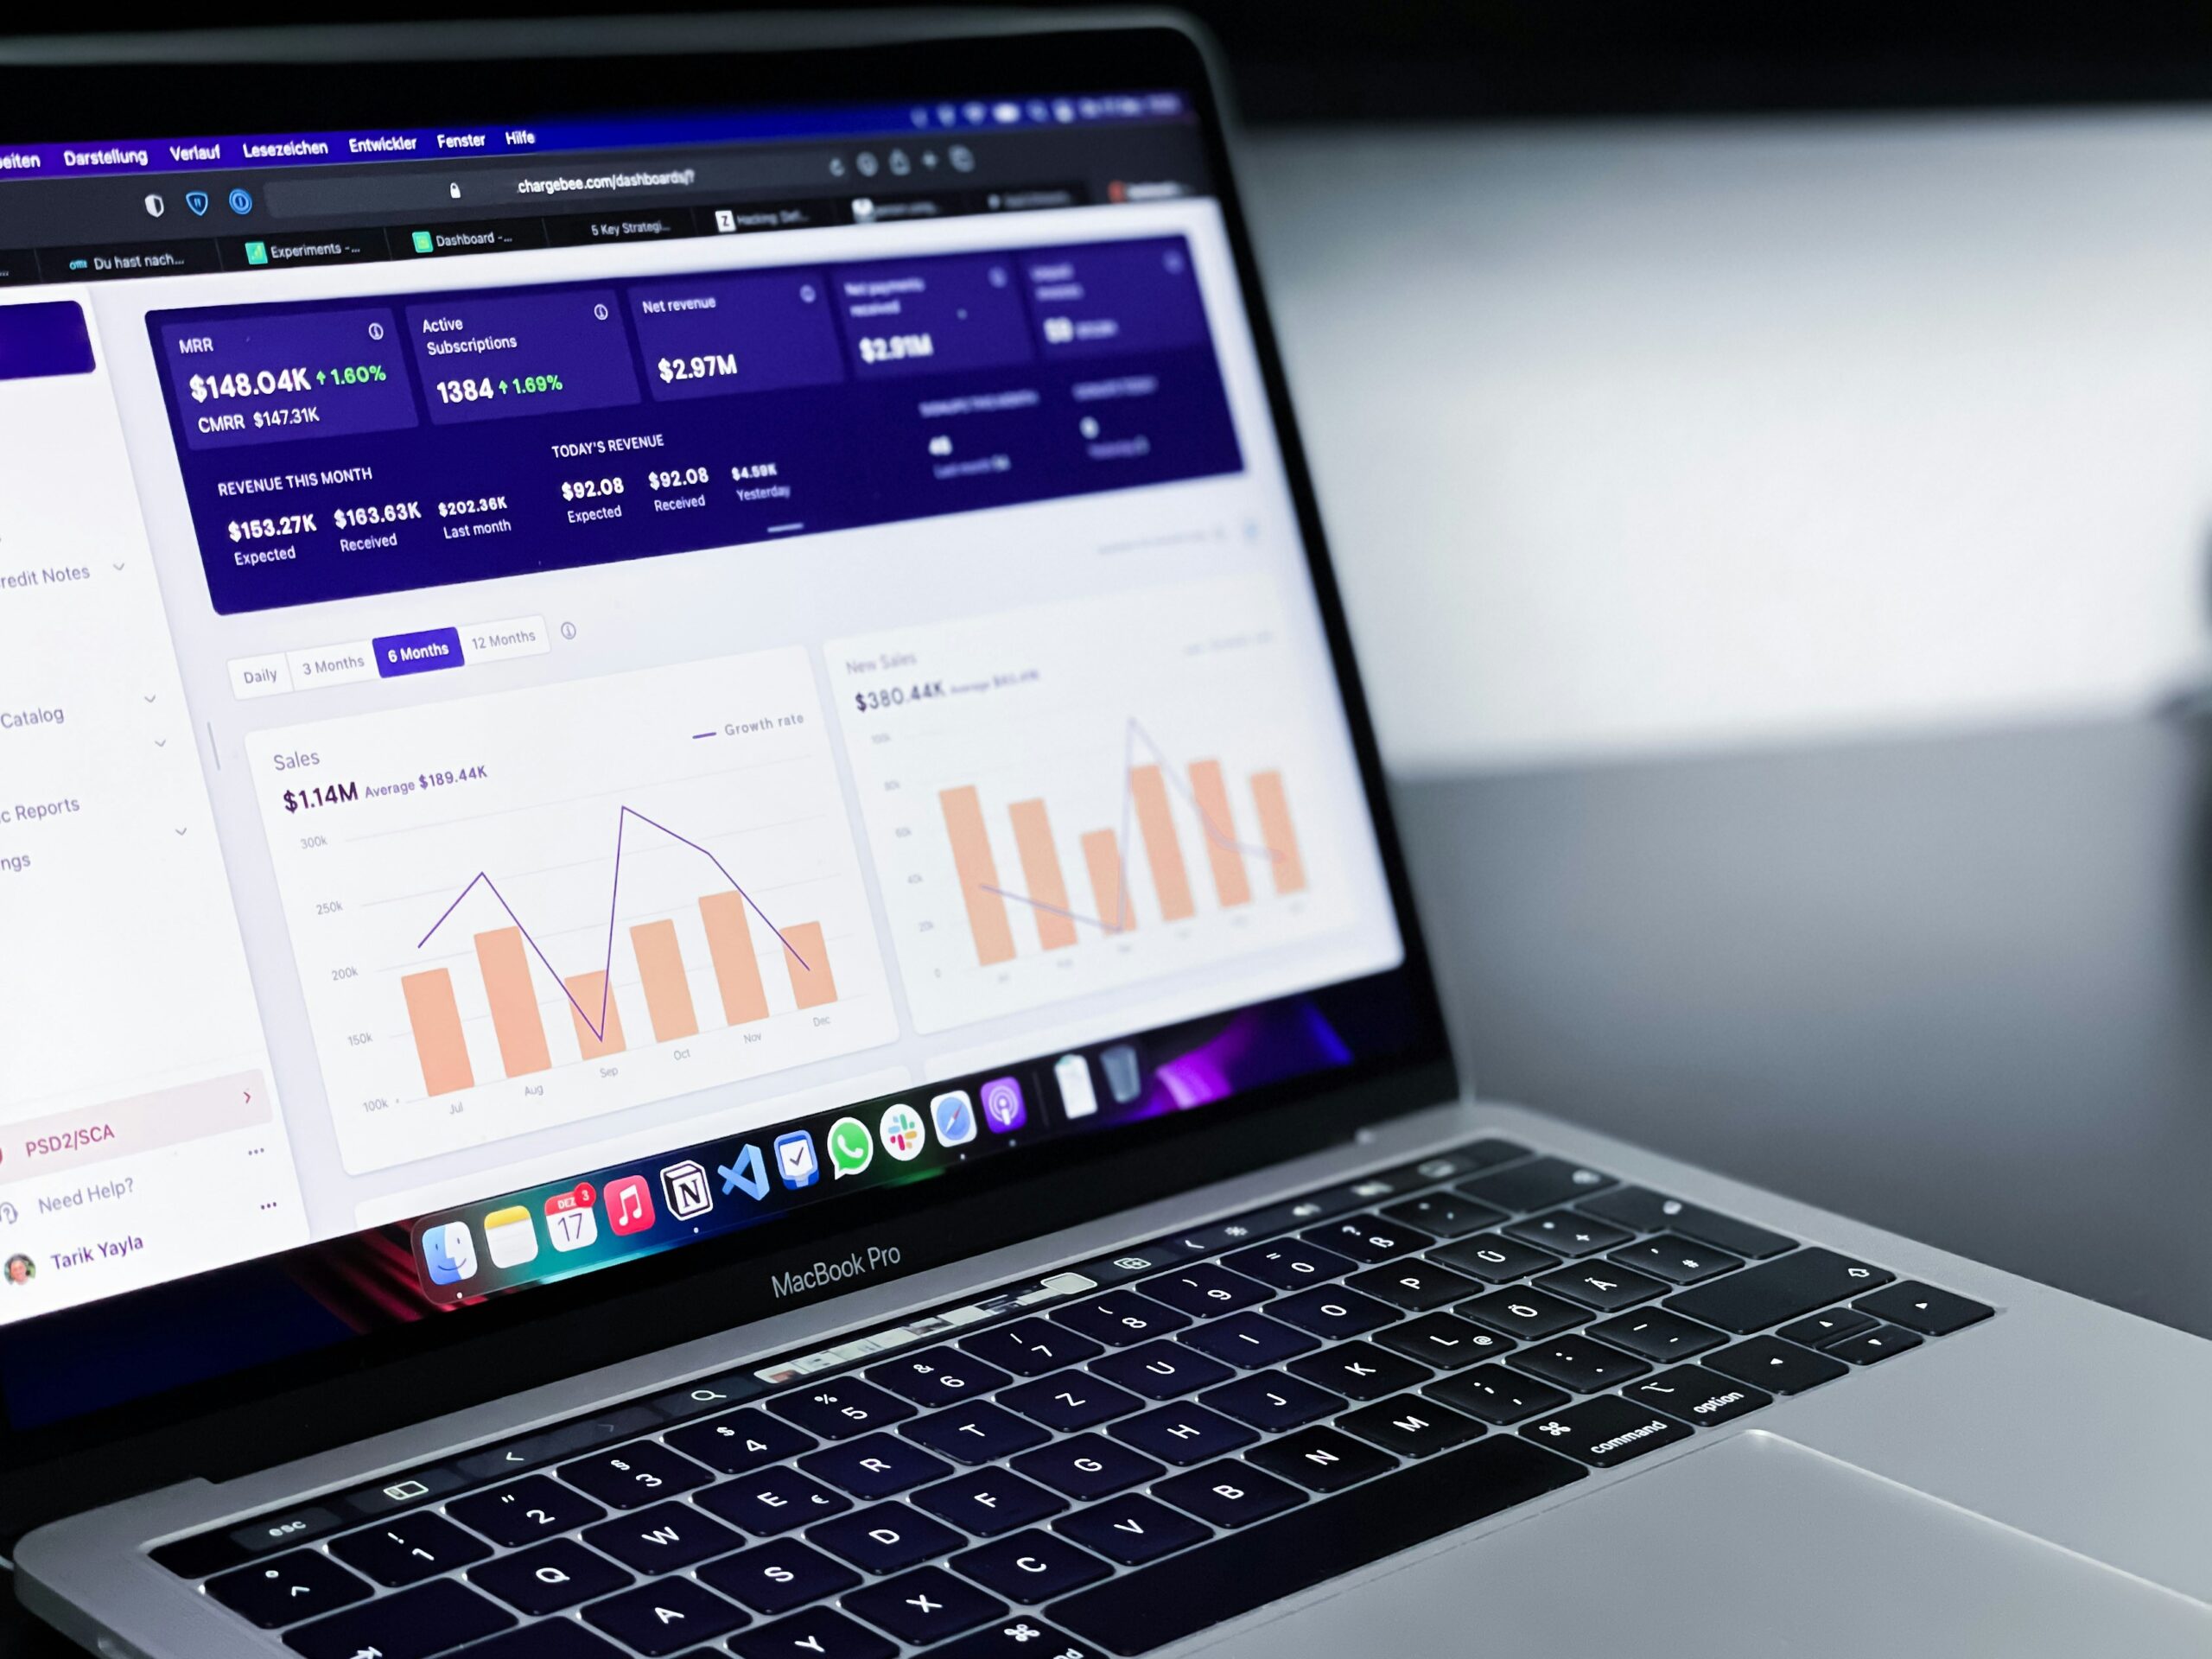
How advanced analytics helps different teams
Different teams need different views of the same business.
For leadership, reporting might be about portfolio performance, revenue trends, occupancy, churn and growth across locations.
For finance, the focus could be invoices, overdue payments, customer balances and revenue.
Operations teams may need a closer look at bookings, utilisation, no-shows and resource demand, while community teams might be more interested in member activity and engagement.
Sales teams can also use reporting to understand plan performance, opportunities, contracts, pipeline and high-value customers.
Advanced analytics allows each team to work with the information most relevant to its role, without requiring everyone to use the same report.
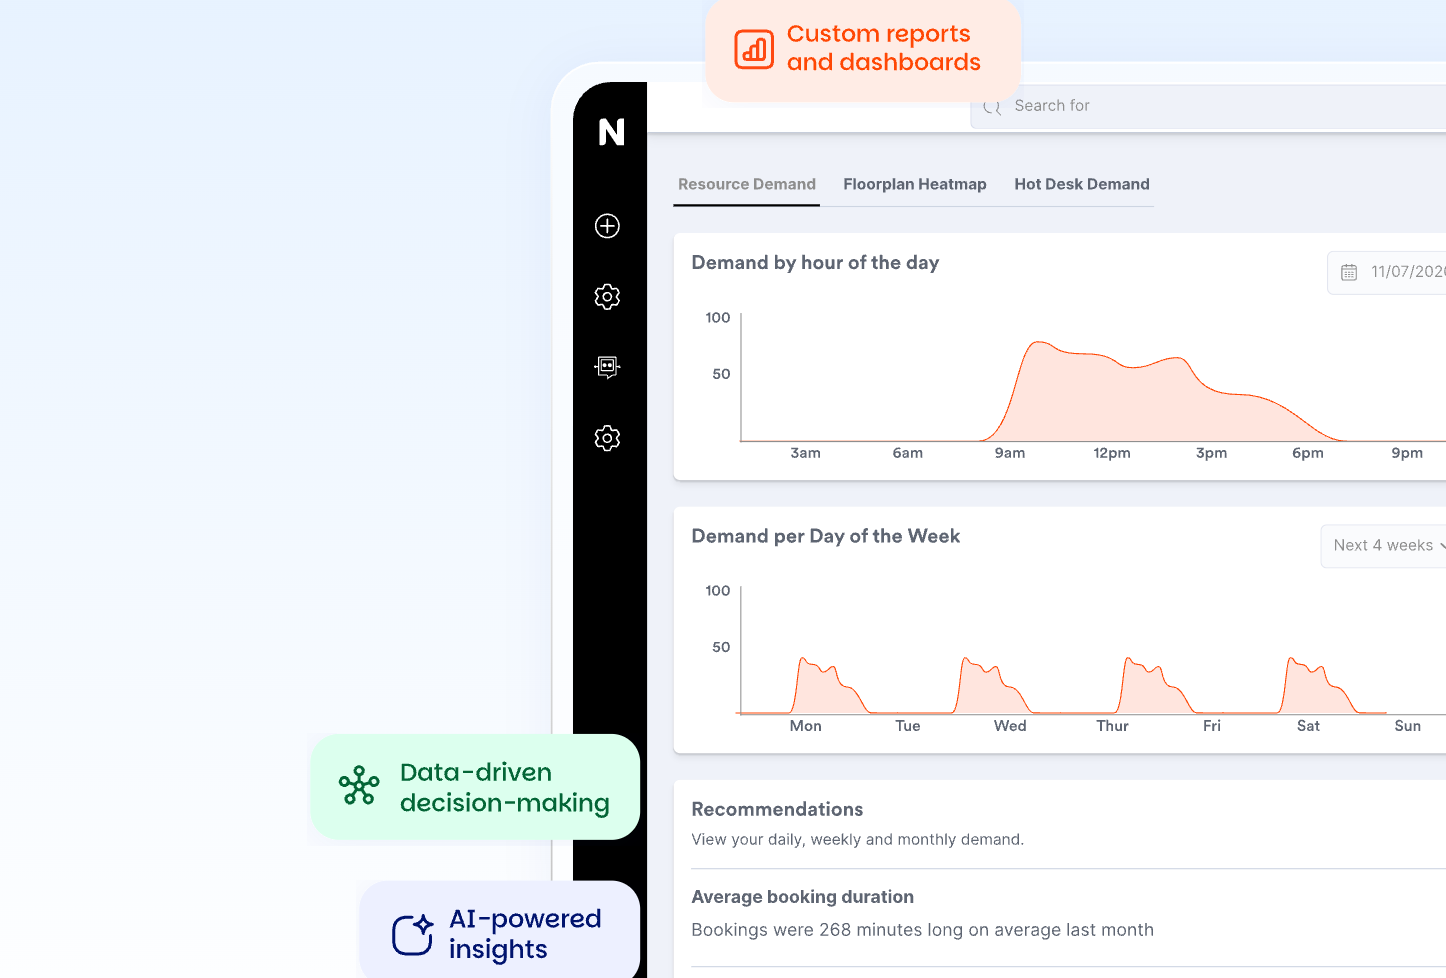

How Nexudus Explore supports advanced reporting
Explore gives coworking teams a reporting layer inside Nexudus, with dashboards and reports that can be adapted as reporting needs become more specific.
Teams can start with pre-built dashboards for an overview of performance, then use filters and more detailed reports to investigate the data behind their KPIs.
For more advanced reporting needs, teams can adapt dashboards, build custom reports, export data and schedule reports for regular delivery.
This gives operators a way to use standard reporting for everyday questions while having more flexibility when they need to go deeper.
An advanced analytics checklist
If you’re considering whether your current reporting setup is still enough, ask yourself:
- Are teams still exporting data into spreadsheets every month?
- Can you filter reports by location, plan, customer or resource?
- Can you drill from summary KPIs into the records behind them?
- Can different teams get the views they need?
- Can reports be scheduled and sent automatically?
- Can you adapt dashboards instead of starting from scratch?
- Can you build custom reports for business-specific questions?
- Can you compare revenue, occupancy, bookings and retention together?
If several of these questions have a “no” answer, it may be time to look beyond standard reporting.
Go beyond standard reports with Explore
Standard reports can give you a strong starting point. But as your business grows, your reporting needs can become more specific.
Advanced analytics gives operators more flexibility to explore the data behind their KPIs, build views around their business and share the right information with the right teams.
Want to know more about
how Nexudus could help your business?
We’re here to answer any questions you have.
Latest articles
-

- Coworking
- Coworking Resources
Practical AI Lessons for Coworking Operators from GWA Denver 2026
Damian on October 1, 2026 -

- Coworking
- Coworking News
- Technology
AI didn’t add a feature to coworking software. It’s rewriting what the product is.
Jane Robathan on September 30, 2026
