


- Coworking
- Coworking Resources
There’s No Excuse Not to Catch Retention Risk Early

TL;DR
A member cancelling is too late. Build a 360° view of retention with this framework, catch risk earlier and turn churn reporting into something leadership can get behind.
A best-in-class retention report should answer three questions:
- What are we losing?
- Where is it happening?
- Is there anything we should act on before more members leave?
And remember: your churn rate belongs in that report, it just shouldn’t be the whole report.
Every lost member has a story
Imagine one of your members cancels today. You record the cancellation (easy), their membership ends (sad), your active-member count drops (another thing to explain later) and your churn rate moves up (sigh).
But what happened before that?
Perhaps they stopped coming in on Fridays a few months ago. Next, their meeting room bookings dropped. Maybe a team of six became four or a team asked to move onto a smaller plan. Eventually, they cancelled.
If you only measure the final event, all of that earlier movement disappears into one number: one lost member.
This is what makes coworking churn tricky.
Coworking memberships don’t always move neatly from active to cancelled. Members downgrade. Teams shrink. Companies move offices. People use the space less while continuing to pay. Some switch plans or locations. Others remain technically active long after their behaviour has changed.
Your reporting needs to follow these tales.
The many faces of churn
A headline coworking churn rate is useful because it gives you a consistent measure over time.
If you started the month with 100 recurring members and eight left, your member churn rate would be 8%.
Member churn rate = members lost during the period ÷ members at the start of the period × 100
While this is useful, it’s incredibly incomplete.
Suppose seven of those members were relatively small memberships and the eighth occupied a large private office.
Eight members left, but the financial impact of those cancellations was very different.
That gives you another measure:
Revenue churn = recurring revenue lost during the period ÷ recurring revenue at the start of the period × 100
Then, we have another consideration: membership movement.
A customer may remain active while terminating one membership. A team may move from a ten-person office to a six-person office. An individual may downgrade from a fixed desk to a lighter plan.
Your customer count barely moves, but the commercial relationship does.
That is why a useful churn report usually needs to consider several things together:
- Member churn tells you how many members you lost.
- Membership churn shows which memberships or contracts ended.
- Revenue churn shows how much recurring value disappeared with them.
- Retention shows how much of your starting member base stayed.
None of these single measures give you the whole picture, you need them all.

Beyond your headline rate
Suppose your churn rate rises from 4% to 7%.
You know something changed but still don’t know where.
Now split that 7% by membership plan.
Perhaps most of the increase comes from one hot-desk membership.
Split it by location and you find the same plan performs normally everywhere except Manchester.
Then look at tenure and discover most of those cancellations happen within the first three months.
The conversation has changed. You’re no longer asking a broad question about why churn increased across the business. You have a much narrower one: Why are newer members on this plan leaving this location?
This is exactly how to get everything that matters from churn reporting.
Look for concentrations by:
- Membership plan
- Location
- Member or customer type
- Length of stay
- Revenue value
Ask better questions
Are members leaving unusually early? Is one plan attracting plenty of signups but struggling to retain them? Does one location have materially higher churn than the rest of the portfolio? Are you losing lots of low-value memberships or a small number of important accounts?
Watch your conclusions
Higher churn in one location doesn’t automatically tell you that its community is poor. A downgrade doesn’t prove the member thinks the plan is too expensive. Your reporting tells you where to investigate. The members themselves, your team and the wider context help explain why.
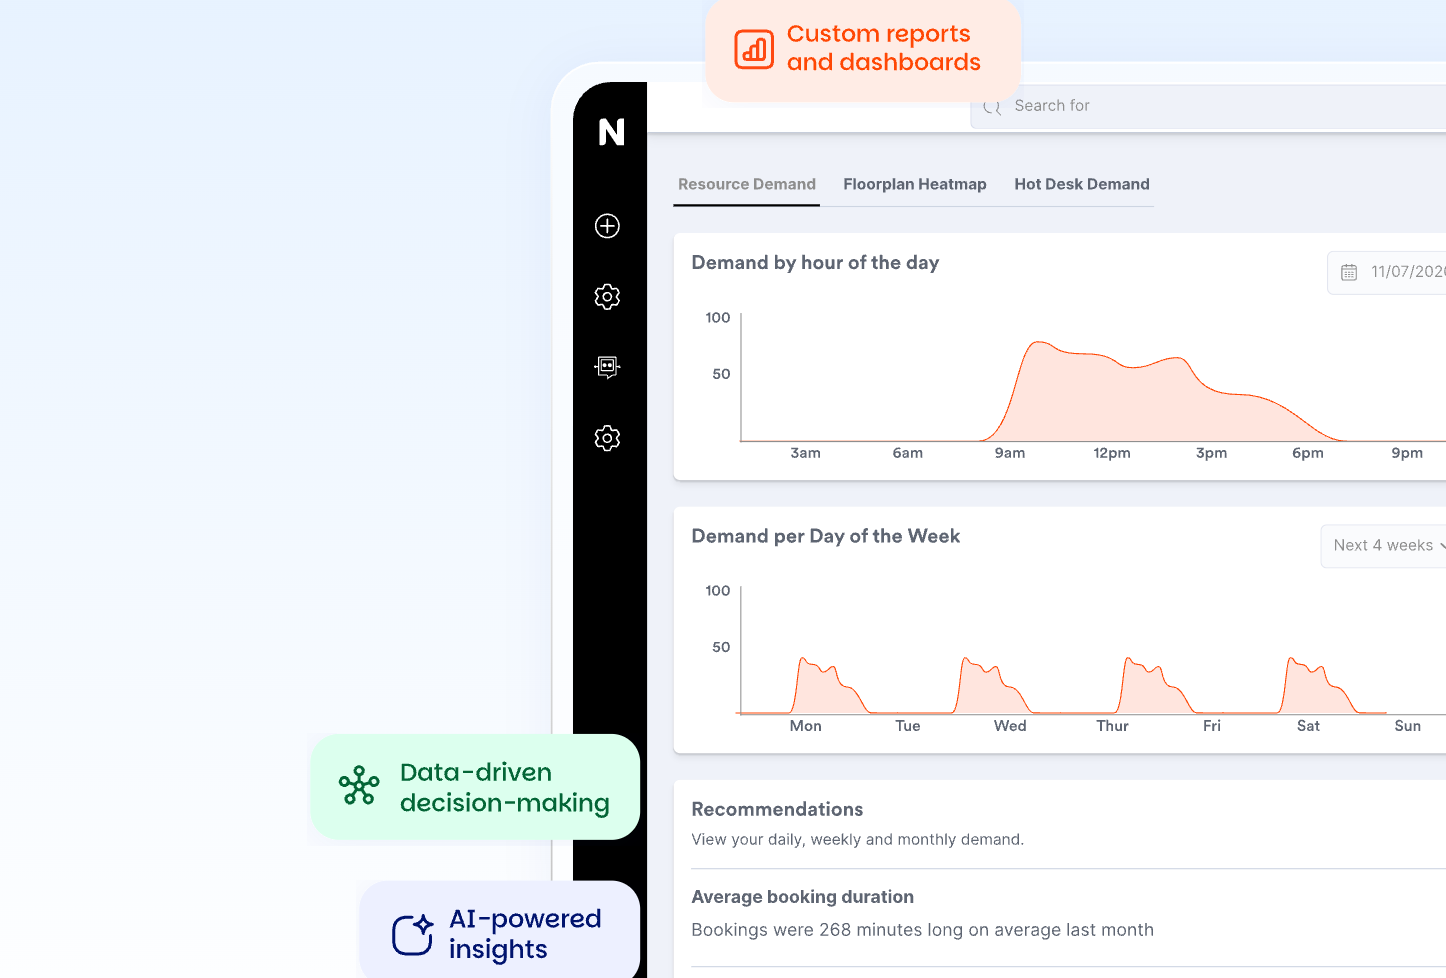
Churn rate is history, engagement is now
This is where retention reporting gets more interesting.
While a cancellation is an unambiguous, historical data point, engagement is a bit messier but more ‘in the now.’
Think about a member who normally visits four times a week, suddenly coming in once.
A company that regularly books meeting rooms might stop, a team could reduce bookings before asking for a smaller office or someone who used to attend events has been MIA from the last three.
None of those behaviours proves that a member is going to leave. Someone could simply be on holiday, a team might be working from a client’s office and quiet months happen.
But changes in behaviour give you something worth paying attention to, especially when several signals move together.
We think operators should pick up patterns across these:
- Bookings
- Check-ins
- Meeting room use
- Purchases
- Logins
- Event bookings
- Community activity
- Support issues
- Payment behaviour
- Plans or team size
A member making one booking this week doesn’t tell you much. A member who made twelve bookings every month for a year and then made one might.
You’re looking for changes in normal behaviour.
Revenue churn should change who gets your attention
Member churn treats each lost member equally, but your business rarely does.
Imagine two months:
Month A: Ten low-value memberships cancel.
Month B: Two members cancel, including a large private-office customer.
Month A has the higher member churn, while Month B probably has a greater commercial impact.
This is why retention reporting should sit alongside revenue reporting.
Track how much recurring revenue leaves with cancelled members, but also look at what happens before cancellation. If a team moves from a £4,000 monthly office to a £2,500 one, you still retained the customer, but £1,500 in recurring monthly value has gone.
The reverse matters too. Existing members may upgrade, expand their team or add services.
Member numbers tell you how many relationships you are retaining, revenue tells you what those relationships are worth, and you really need both.
Reports should show movement
Imagine the month starts with 200 members.
Twenty-five new members join and twenty leave. You finish the month with 205 active members.
The headline is growth, but there has been significant movement underneath that net increase of five.
A useful monthly churn report should make that movement visible.
Include these in your monthly churn report
The point is not to add every possible retention metric. It is to make it easier to see where something has changed enough to need a closer look.
- Member base
Active members, new members, lost members and net growth. - Membership movement
Starts, terminations, renewals, upgrades and downgrades. - Revenue movement
Recurring revenue lost through churn, contraction from downgrades and expansion from existing customers - Engagement
Meaningful changes in bookings, check-ins or other activity. - Exceptions
Plans, locations or member groups behaving differently from their usual pattern.

Turn signals into follow-up
Say you find that members on one plan have been leaving earlier than usual.
The next question is fairly simple: what changed for those members before they cancelled?
You might look at tenure, booking behaviour, check-ins, support history, plan changes or feedback.
The same applies when an individual member’s behaviour changes.
The table wording below matters. These signals suggest something may have changed; they do not tell you why.
Lower check-ins could mean weaker engagement, or they could mean somebody is travelling more. A downgrade might reflect budget pressure, but it could equally mean the member’s team has become smaller.
Use the data to decide where a conversation or a little more investigation might be worthwhile.
| Signal | What it could mean | Next step |
| Bookings have dropped sharply | The member's need for the space may have changed | Check recent activity and speak to the member |
| Member asks to downgrade | Budget, usage or plan fit may have changed | Understand what they now need from the space |
| Overdue invoices are increasing | Payment difficulties may affect retention | Coordinate finance follow-up |
| Check-ins are well below the member's usual pattern | Engagement may be falling | Review their wider activity before reaching out |
| Churn has increased in one plan | Something about the plan or the customers buying it needs investigation | Compare tenure, location, pricing and cancellation reasons |
Give retention reporting an owner
Retention cuts across several parts of the business.
Community teams may notice changes in member behaviour. Finance sees payment issues. Operations understands how people are using the space. General managers can see whether a change is isolated or showing up more widely.
You don’t need every team reviewing every metric.
Instead, decide who is responsible for bringing the relevant information together and making sure anything important gets followed up.
That could mean community reviewing recent cancellations and engagement changes, finance flagging meaningful payment issues and operations adding context where usage has shifted.
Then bring the actions back into the next review.
Did the member stay? Did the downgrade go ahead? Did churn on that plan settle down? Is the same location still losing members at a higher rate?
That gives the reporting some continuity without turning retention into another large reporting exercise.

Predictive churn adds another signal
Historical behaviour can also help teams decide where to look more closely.
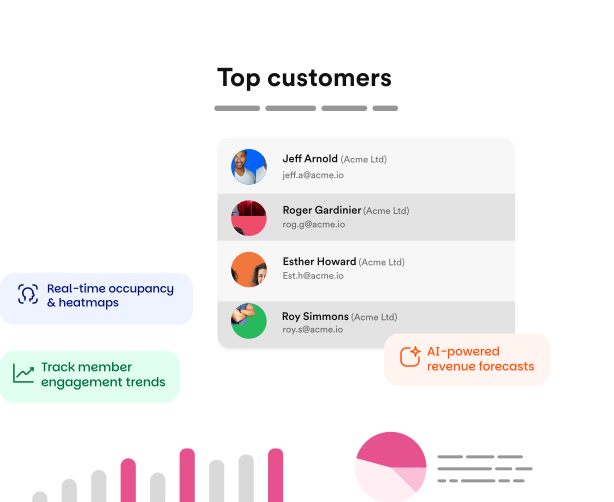
Nexudus Churn and Engagement shows members who may be likely to churn within the next 30 days and groups engagement into four levels: high, medium, low and none.
These are predictions, so they are most useful alongside the other information your team already has about a member.
The dashboard needs around three months of historical data before it can produce its first predictions, with predictions updated at the start of each calendar month.
If someone appears at higher risk, look at their recent activity, membership changes and any relevant payment or support issues before deciding whether to follow up.
Explore brings retention into the wider picture
Retention rarely makes sense in isolation.
Churn may rise alongside falling bookings. Member numbers may stay fairly stable while revenue churn increases. One location may be growing while another loses long-standing members.
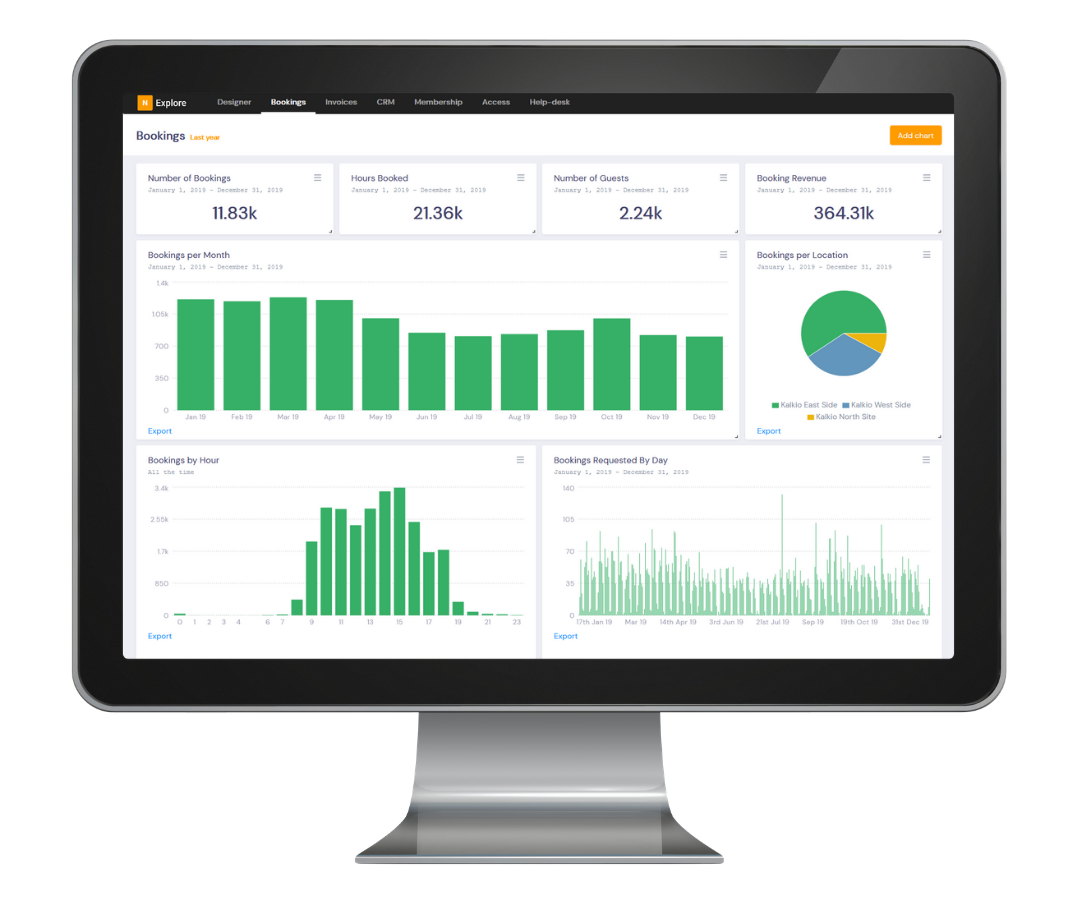
Explore brings membership lifecycle, retention and churn reporting together with other areas of the business, including revenue, bookings and operational activity.
Teams can start with the overall movement, then filter and drill into the detail when something needs explaining. Reports can also be exported to PDF or Excel and scheduled for delivery, while Explore Pro supports more advanced custom reporting and saved dashboards.
That makes it easier to include retention in the same reporting process as the rest of the business rather than treating it as a standalone number.
Looking beyond churn rate
You won’t explain every cancellation through reporting alone.
But tracking member churn alongside membership changes, revenue and engagement gives you a better idea of where retention is changing and where it is worth looking more closely.
Start with the headline rate, then break it down by plan, location, member type and value. When something stands out, investigate it.
That is enough for churn reporting to become useful without making it more complicated than it needs to be.
Want to know more about
how Nexudus could help your business?
We’re here to answer any questions you have.
Latest articles
-

- Coworking
- Technology
Nexudus AI Agents: The Different Types and What They Do
Emily Nguyen on October 12, 2026 -

- Coworking
- Coworking Resources
Practical AI Lessons for Coworking Operators from GWA Denver 2026
Damian on October 1, 2026 -

- Coworking
- Coworking News
- Technology
AI didn’t add a feature to coworking software. It’s rewriting what the product is.
Jane Robathan on September 30, 2026