- Coworking
- Coworking Resources
What Is the Flexspace Observatory? Coworking Data and Benchmarks Explained

Coworking data is everywhere, but meaningful benchmarks are surprisingly hard to find. Most coworking operators can see their own occupancy, revenue, member retention, and resource usage, yet it’s much harder to understand how those numbers compare to the wider market.
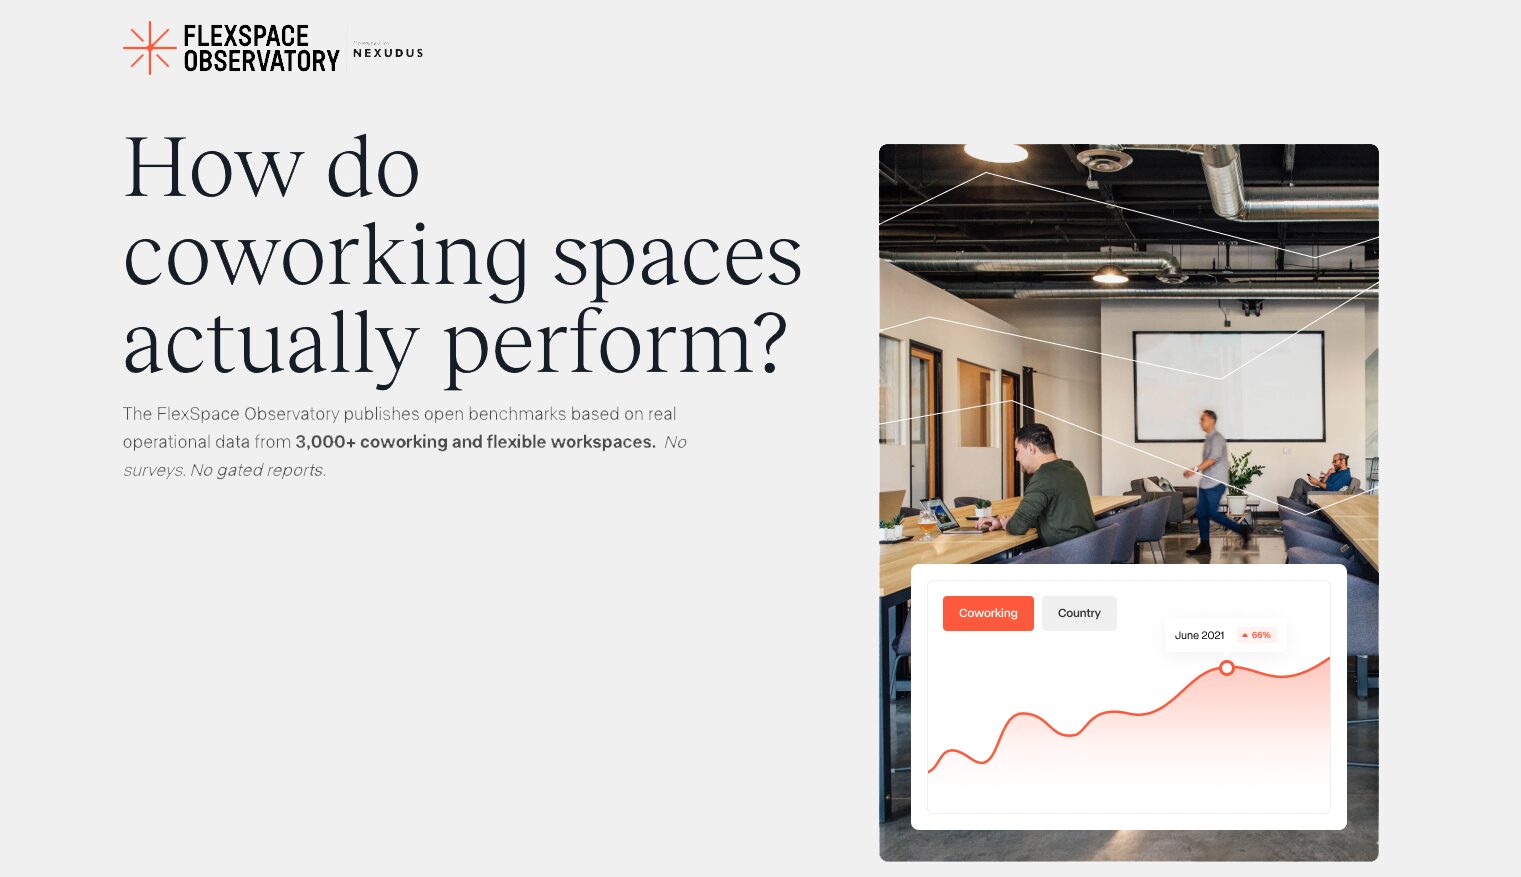
The Flexspace Observatory exists to provide that context. Built from anonymised operational data spanning thousands of coworking and flexible workspaces worldwide, it turns real-world workspace activity into industry benchmarks and trend reports, helping operators understand how the market is evolving and how their own performance compares.
What is the Flexspace Observatory?
The Flexspace Observatory is an ongoing benchmarking initiative designed to help the coworking industry better understand itself.
Every quarter, anonymised data from thousands of workspaces is analysed and published as a series of reports covering key operational metrics, industry trends, and market comparisons.
Instead of focusing on individual case studies or isolated success stories, the Observatory looks at patterns across thousands of spaces simultaneously. This makes it possible to identify broader industry shifts that would be almost impossible to spot from a single workspace’s data alone.
The reports explore questions such as:
- How are workspace products evolving?
- Which resources are used most frequently?
- How long do members typically stay?
- How do different markets compare?
- What factors influence workspace performance?
By answering these questions with real operational data, the Observatory helps turn industry conversations into evidence-based insights.
Why benchmarking matters in coworking
Running a coworking space is full of decisions.
Should you increase prices? Expand your private office offering? Reconfigure underused areas? Invest more heavily in community programmes? Focus on member retention?
The quality of those decisions depends heavily on context.
Imagine a workspace operating at 70% occupancy. At first glance, that number might seem healthy. But if comparable spaces in the same market are consistently achieving 85%, it suddenly tells a different story.
The same principle applies to almost every aspect of workspace management.
A decline in meeting room bookings could indicate a problem, or it could reflect a wider shift in how members use flexible workspaces. A rise in member churn could signal a retention issue, or it could simply mirror changing patterns across the broader market.
This is one of the reasons benchmarking has become such an important tool across industries. Hotels benchmark occupancy rates. Retail businesses compare sales performance. Airlines track load factors. Coworking operators increasingly need the same ability to compare their own performance against wider market trends.
Benchmarking doesn’t replace experience, instinct, or local knowledge. It simply gives operators more information to work with.
Why the Flexspace Observatory was created
Every booking, membership change, resource reservation, and occupancy update adds to a growing picture of how people use coworking spaces, yet most of the research available to operators still comes from surveys. While surveys can provide valuable perspectives, they often depend on who chooses to participate and how questions are interpreted. Results can vary significantly depending on sample size, geography, and methodology.
The Flexspace Observatory was created to take a different approach. Rather than asking operators what they think is happening, it looks at what is actually happening. By analysing operational data at scale, the Observatory provides a more objective view of how the industry functions and how it continues to evolve.
The aim isn’t to tell operators what decisions they should make – it’s to help them make better-informed decisions by providing a clearer view of the wider market.

Where the data comes from
The Flexspace Observatory is powered by anonymised and aggregated operational data collected from more than 3,000 workspaces across over 90 countries.
This includes information relating to:
- Workspace utilisation
- Resource bookings
- Membership activity
- Product demand
- Occupancy patterns
- Member retention and tenure
Before any analysis takes place, data is anonymised and aggregated to ensure that no individual workspace or member can be identified.
This allows the Observatory to identify industry-wide patterns while maintaining privacy and confidentiality.
What metrics does the Flexspace Observatory track?
The Observatory focuses on metrics that help operators understand demand, performance, and member behaviour.
Resource demand
One of the clearest indicators of changing workspace preferences is how members use resources.
The Observatory tracks demand across products such as hot desks, dedicated desks, private offices, meeting rooms, and shared amenities. This helps identify shifts in member behaviour and changing expectations around workspace flexibility.
As hybrid working continues to evolve, understanding resource demand has become increasingly important for operators planning future layouts and service offerings.
Occupancy and utilisation
Occupancy remains one of the most closely watched indicators in the coworking sector.
The Observatory analyses utilisation patterns across different markets, workspace sizes, and regions to help operators understand how their own performance compares with broader industry benchmarks.
This context can be particularly valuable when evaluating growth opportunities or identifying underutilised capacity.
Member tenure
Member retention is often viewed as a key indicator of workspace health.
The Observatory examines how long members typically stay and how tenure varies across different membership types, workspace sizes, and markets.
Rather than relying on simple averages, the reports explore the wider patterns behind member behaviour, providing a more nuanced view of retention.
Market comparisons
Not all coworking markets behave in the same way.
A workspace in the UK faces different challenges and opportunities than one in the US or Spain.
That’s why the Observatory places significant emphasis on regional comparisons, helping operators understand how local performance fits within wider industry trends.
Workspace size analysis
The needs of a small independent coworking space often differ significantly from those of a larger operator with multiple locations.
The Observatory explores how workspace size influences demand, occupancy, and member behaviour, providing more relevant benchmarks for different business models.
What the data is already telling us
One of the most interesting aspects of the Flexspace Observatory is the way it highlights differences that many operators instinctively suspect but struggle to quantify.
Early reports have shown that demand patterns vary considerably between markets. What works in one country doesn’t always translate directly to another.
The data has also highlighted the industry’s continued shift towards greater flexibility. Today’s workspace landscape looks very different from the one that existed a decade ago, with private offices, flexible memberships, and hybrid work patterns playing a much larger role in how spaces are designed and operated.
Another important finding is that averages rarely tell the full story.
Two workspaces can share similar occupancy rates while experiencing completely different utilisation patterns. Two operators can report similar retention figures while serving very different member profiles.
This is why the Observatory focuses on context rather than headline numbers alone.
As more quarterly reports are added, the Observatory will continue building a richer picture of how the industry evolves over time.


Who uses the Flexspace Observatory?
Workspace operators are the primary audience, but they’re far from the only people who benefit from the data.
General managers use it to benchmark performance and support strategic planning.
Community and operations teams use it to better understand member behaviour and resource demand.
Investors and property owners use it to assess market performance and identify opportunities.
Consultants, brokers, and analysts use it as an independent source of industry insight when advising clients or evaluating market trends.
Anyone looking to understand the future of flexible work can benefit from the broader perspective the Observatory provides.
How operators can use the insights
The most immediate application is benchmarking.
Comparing your own occupancy, retention, pricing strategy, or resource utilisation against wider industry trends provides valuable context for decision-making.
The insights can also support:
- Pricing reviews
- Capacity planning
- Product development
- Expansion decisions
- Revenue forecasting
- Retention initiatives
- Operational improvements
Importantly, the Observatory is not intended to replace an operator’s own reporting.
Your internal data tells you what is happening inside your workspace.
The Observatory helps explain how that performance compares to the wider market.
Together, they provide a much stronger foundation for decision-making.
Explore the latest Flexspace Observatory reports
New Flexspace Observatory reports are published quarterly and added to a growing archive of industry research.
Alongside the core reports, you’ll also find deeper analysis covering market comparisons, workspace size benchmarks, resource demand trends, and member behaviour.
Together, these reports provide one of the most comprehensive views of the coworking industry available today.
Want to know more about
how Nexudus could help your business?
We’re here to answer any questions you have.
Latest articles
-

- Coworking Resources
- Technology
What Makes Coworking Software Agent-Ready?
Jane Robathan on July 14, 2026 -

- Coworking
- Technology
What Is White Label Coworking Software? A Guide for Workspace Operators
Emily Nguyen on July 13, 2026