- Coworking
- Coworking Resources
Essential Metrics and KPIs to Measure, by Mark Navarro

We spoke to coworking expert Marc Navarro to explore key coworking space metrics and KPIs to track business success. Learn which formulas and KPIs Marc uses to optimise occupancy, revenue, and member engagement.
Running a coworking space used to be all about instinct—but not any more. It was once easy to tell if a space was buzzing, if the meeting rooms were in demand, and if members were smiling at the coffee machine. But in today’s market—with much larger spaces, more private offices, and stronger competition—operators need more than gut feeling. They need the right data to steer their business in the right direction.
If you’re relying solely on occupancy to judge performance, you’re likely missing key signals. The coworking KPIs you track should give you the full picture: member engagement, space usage, churn risk, revenue streams, and operational efficiency.
In this post, we’ll walk through the essential coworking performance metrics you should monitor to know whether your space is truly thriving.
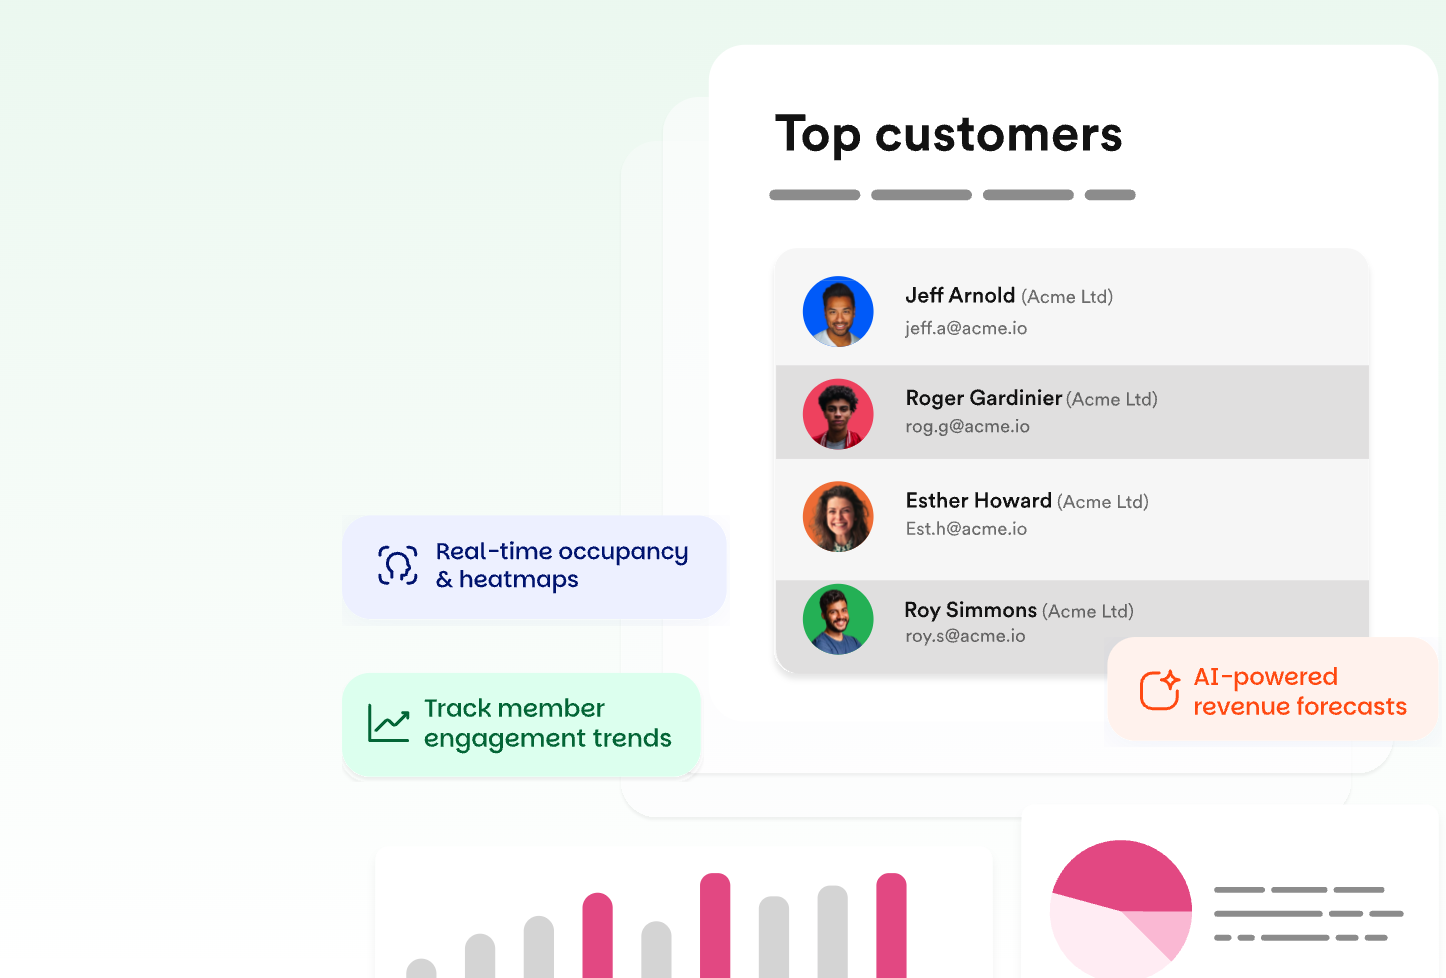
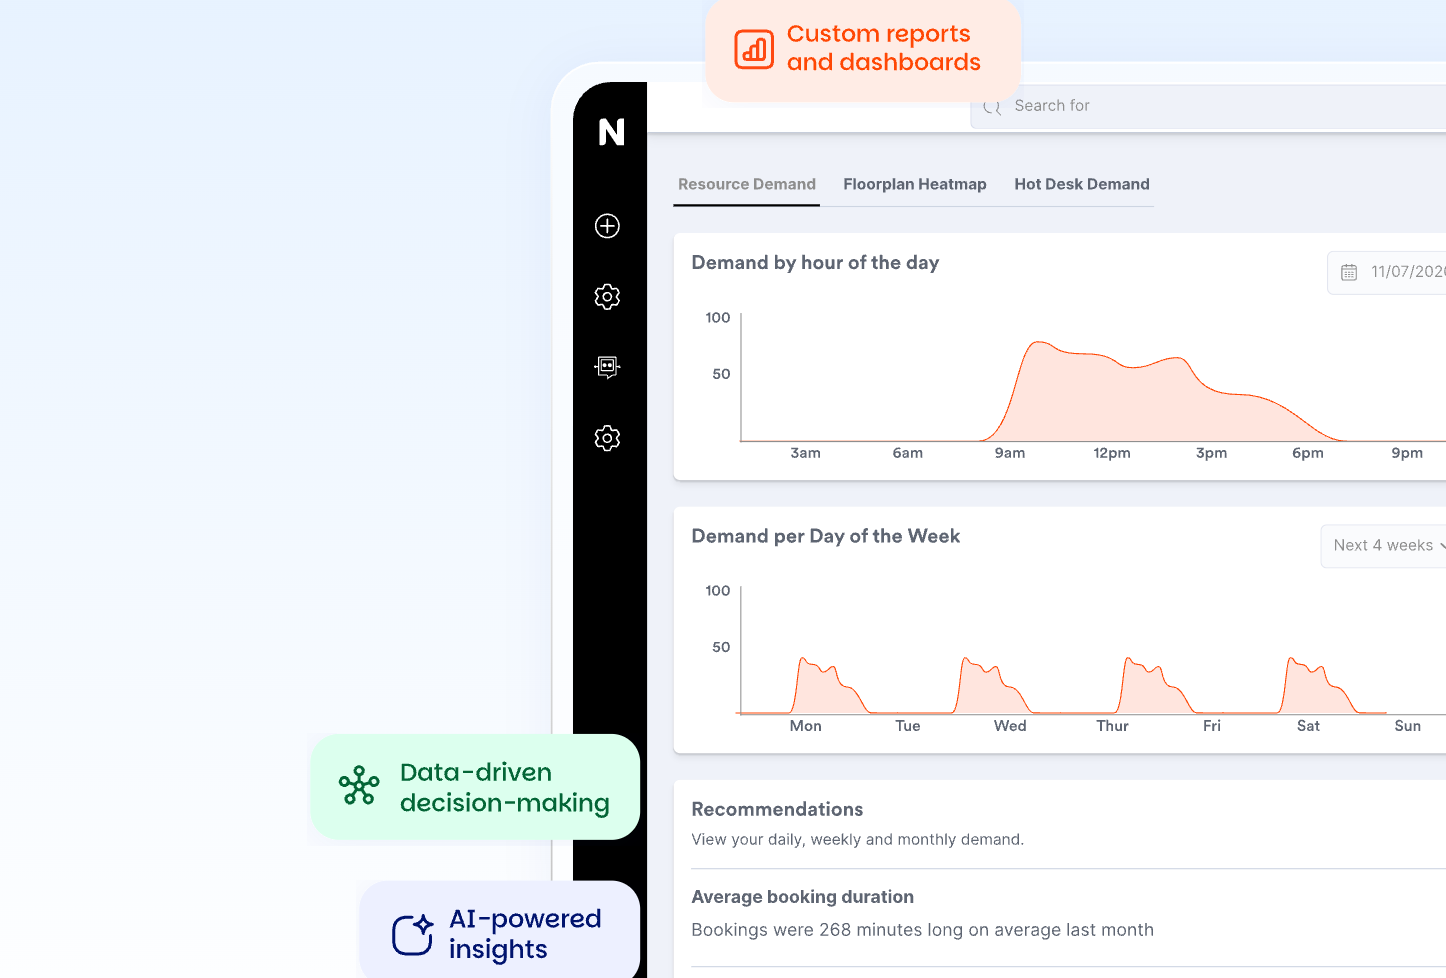
Using software designed for coworking spaces with built-in analytics makes this both easier and actionable and is something I’d thoroughly recommend operators do.


Top Coworking Space KPIs to Track
Let’s look at the metrics and KPIs that will make a difference to your planning and bottom line.
Profit & Loss
Maybe this shouldn’t be on the list—but let’s start simple: how much are you making? How much are you spending? Get the basic economics nailed down.
A P&L statement typically includes
- Total sales or revenue
- Operating expenses (e.g., wages, rent, utilities)
- Cost of goods sold (if any)
- Other income and expenses (e.g., interest, taxes)
- Net profit or net loss (the “bottom line”)
It helps you—and your managers—understand how well the business is generating income, controlling costs, and managing profitability.
Remember to compare these figures not only with the previous month, but also with the same month last year, as coworking can be seasonal.
Monthly Recurring Revenue (MRR)
Another key financial coworking space metric is Monthly Recurring Revenue. In coworking spaces, revenue from non-recurring services—like meeting room rentals, events, day passes, training sessions, etc.—is important, but by nature, it’s unpredictable and pay-per-use. You can’t rely on it as stable income.
To calculate MRR, add up the revenue from all your recurring services. Do this not only for the current month but also for the upcoming months, based on the contracts you already have in place. This allows you to forecast future income and proactively plan things like space renovations or discount campaigns.
If you offer dedicated desk memberships with one-month contracts, consider adjusting your future MRR projections by subtracting the Revenue Churn (we’ll cover this metric later) specific to that membership type. Use either the annual churn rate or the churn rate for that specific month—whichever is higher—to keep your projections realistic.
Physical Occupancy and Economic Occupancy
Occupancy—technically, the Physical Occupancy Rate (POR)—isn’t enough on its own, but it’s the best place to start. Traditionally, it has been the cornerstone of metrics in coworking spaces.
Your POR tells you
- How you’re doing overall.
- How much room you still have to grow.
- How to adjust your discount strategy: offer higher discounts at low occupancy and lower discounts when occupancy is high.
Here’s the POR formula
Physical Occupancy Rate = (Number of occupied desks / Total available desks) × 100*
*For offices always consider the offices total number of desks as you are selling the office as a single unit.


Economic Occupancy Rate (EOR)
EOR is actually a coworking revenue metric, but it’s a must-have. It helps you measure:
- How you’re really doing.
- The actual revenue performance of your services.
You should calculate both POR and EOR for each of your services to gain more granularity and better understand their individual performance.
Here’s how to calculate EOR
Economic Occupancy Rate = (Collected income / Gross potential income) × 100
Why compare POR with EOR?
Let’s say coworking space X has 90% physical occupancy, but the numbers still look underwhelming, and the managers are concerned.
After reviewing the data, they calculate the economic occupancy rate and discover it barely reaches 70%.
Looking deeper into EOR by service, they find that private offices are underperforming. Why? During the launch, they offered massive discounts—and never updated the pricing since.
There are other ways to assess performance, like Average Revenue Per Member (ARPM), which we’ll revisit later. But Economic Occupancy offers a clearer view across all services, showing at a glance where your attention is needed. It reveals how much you’re actually making compared to what you should be making.
It’s important to compare both occupancy metrics. A space operating at 100% physical occupancy still incurs full operational costs—but if the EOR is significantly lower, you’re not earning what a “full” space should generate.
When comparing POR and EOR, consider what you can learn from a temporary or persistent imbalance between the two.
For instance, if your EOR is consistently lower than your POR, it means you’re not able to sell at full price—so it’s worth investigating why.
Common reasons for a POR–EOR imbalance
- Aggressive or outdated discount policies
- Overly optimistic pricing
- Economic slowdown
- Competitor pricing or promotional pressure
- An outdated or less appealing space
Tracking both workspace performance metrics over time gives you a much clearer picture of what’s really happening—and helps you respond accordingly. You might, for example, be in an aggressive discount phase after a recent expansion. That’s fine—as long as you’re aware and in control of the strategy.
How to calculate occupancy for Pay-Per-Use services
Looking at pay-per-use services, to simplify things, we’ll focus on how often day passes are actually used, not when they’re purchased. Use the following formulas for the time period you’re measuring:
- Occupancy Rate = (Number of day passes used / Total available day pass seats) × 100
- Occupancy Rate = (Number of meeting room hours booked / Total available meeting room hours) × 100
In the case of meeting rooms, a few additional considerations are worth noting:
- How we define total available hours will impact the metric. For instance, counting 24-hour days vs. only open hours will yield very different results. It’s recommended to use the full range of available hours—including outside regular business hours—to encourage creativity in monetizing the space 24/7.
- It’s important to track free usage by members vs. paid usage.
Tracking member engagement data
Churn Rate
Churn Rate answers the question: What percentage of members leave the space each month? It’s key for predicting future revenue, which is why it’s so important.
Here’s the formula for churn rate
Churn Rate = (Number of Recurring Customers Lost During the Period / Number of Recurring Customers at the Start of the Period) × 100
It’s a good idea to track both monthly and annual churn rates, since coworking can be seasonal, and having both figures offers better insight and security.
However, not all customers are equal, so it’s useful to have a more precise metric. There are two main ways to approach this, but the most effective is up next.
Gross Revenue Churn Rate
Use Gross Revenue Churn Rate instead of the Net Revenue Churn Rate (which includes Expansion MRR—in other word, new revenue from existing customers).
Gross Revenue Churn does not include new business won during the period, so it avoids giving a false sense of stability caused by marketing efforts masking high churn.
Here’s the calculation
Gross Revenue Churn Rate = (Lost Recurring Revenue in Period / Recurring Revenue at Start of Period) × 100


Member engagement data
It’s essential to get feedback on how members feel, and the most practical way to do that is through an anonymous survey. However, we must remember that in person we can ask dozens of questions and have a natural conversation—but in a survey, the same approach feels like an interrogation.
Net Promoter Score (NPS)
That’s why I recommend using a survey to calculate your NPS. In short, NPS is a membership engagement metric used to measure customer loyalty and satisfaction by asking them questions like:
How likely are you to recommend this company, product, or service to others on a scale from 0 to 10?
- Promoters (9–10): Loyal enthusiasts who will keep buying and refer others
- Passives (7–8): Satisfied but unenthusiastic; at risk of switching to competitors
- Detractors (0–6): Unhappy customers who may damage your brand through negative word-of-mouth
The survey should include a rating field (0–10) and a free-text field so users can leave any feedback they wish.
Working out your NPS is straightforward
NPS = % Promoters − % Detractors
But of course, things aren’t always that simple:
- Create a different survey for each type of service to get independent insights into customer satisfaction with each one.
- If the service involves both decision-makers and end users, design separate surveys for each. If the decision-maker is unhappy, that’s a much more immediate threat than if only the users are dissatisfied.
- One slightly sketchy—but potentially useful—tactic is to create personalised surveys for your key clients, to gather targeted feedback. If you go this route, do not state anywhere that the survey is anonymous.
Usage for Recurring Services
Some people won’t respond to surveys, no matter how streamlined they are. For recurring services, a strong alternative membership engagement metric is how much members are actually using what they’re paying for.
Each service is different, and depending on how you manage your space, usage may be harder to measure for some.
But it’s well worth the effort—low usage often signals early cancellation.
Usage metrics in general
- In the case of private offices, dedicated desks, or day pass bundles, the number of days members actually show up is a relevant data point.
- For virtual office users, usage could mean how much mail they receive or whether they book meeting rooms.
Looking at actual usage vs. contracted usage
Tracking actual usage vs. contracted usage, and calculating averages per customer, can tell you:
- Whether a contract or service is at risk of cancellation or non-renewal
- The real cost of delivering that service to the client
Here’s the formula for usage
Usage = Days Used / Membership Duration in Days x 100*
You can adjust for a 10 days bonus, for example.
Remember, not all customers are the same, so averages can be misleading. If a member’s usage is far below average, flag them for a casual check-in next time they visit—or send a friendly email to ask how things are going. You might get valuable context.
Consider extending this kind of usage analysis to other areas beyond recurring services, like events, to understand how much value individual members are truly getting from your offerings.
Takeaway for workspace occupancy and revenue
The workspace performance metrics rabbit hole is endless—but the key is to strike a balance between the effort needed to gather data and the insights it provides.
Make your numbers work, not just sit in a dashboard
Track the few metrics that tell the truth (MRR, POR vs EOR, churn, NPS, usage), review them on a cadence, and act when a trigger hits. That’s how you protect revenue, spot risk early, and keep members happy.
If you want this without the spreadsheet hassle, plug your space data into a tool built for operators and set alerts for the thresholds that matter to you.
Your 30-day measurement plan
If you’d like to try any of Marc’s metrics, here’s a 30-day “make it real” plan you can try using Nexudus data and reporting.
Week 1 — Baseline
-
Export last 12 months for: MRR, POR/EOR by service, churn (logo + gross revenue), NPS, usage.
-
Document today’s discount rules and list active promos.
Week 2 — Build your scorecard
-
Pick 6 metrics max. Set targets + trigger thresholds (e.g., “EOR < POR by 10 pts for 2 weeks”).
-
Assign owners: Finance (MRR/churn), Ops (POR/EOR), Community (NPS/usage).
Week 3 — Automate + alert
-
Create one dashboard. Add weekly email/slack alerts for each trigger.
-
Add a “Why?” note field to capture causes (pricing, promo, seasonality).
Week 4 — Act + review
-
Run one pricing/packaging test or member-save play based on the triggers.
-
Hold a 30-minute review. Keep what moved the needle, drop what didn’t.


Want to know more about
how Nexudus could help your business?
We’re here to answer any questions you have.
Latest articles
-

- Coworking
- Coworking Resources
How to Monetise Every Part of Your Coworking Space
Kate Tattersfield on April 1, 2026 -

- Coworking
- Coworking Resources
Coworking Self-Service vs Staff Dependency: How the Member Experience Really Scales
Kate Tattersfield on March 30, 2026 -

- Coworking
- Coworking Resources
- Hybrid work
How to Launch Fractional Offices in Your Coworking Space
Kate Tattersfield on March 25, 2026